
Economics is an uncertain science. What causes the real economy to change, how significant the changes are, how quickly they occur and how long they last for cannot be predicted with any certainty.
While economists might be able to accurately generalise whether a variable (e.g. price) is likely to rise or fall in response to a change in another variable (e.g. demand or supply), most will agree that it is almost impossible to know how large the change will be, how long it will take to emerge and how long the change will last for.
They will also recognise that although the assumption of ceteris paribus makes economic analysis easier, the real world does not reflect ceteris paribus and this nearly always means that changes in other variables will conceal or counteract the expected changes so that it seems like they didn't actually happen.
These uncertainties define what evaluation is and what students need to do in exams to convince examination markers that they have adequately demonstrated this skill.
A good way of working with this in exams is to start your answer with a ceteris paribus assumption so that you can clearly analyse the general changes you are considering and then evaluate this analysis by explaining that you understand the uncertainties attaching to the precise outcome (low level evaluation) and then identify some of the other factors that might result in a more or less significant or completely different outcome to the outcome your analysis predicts.
A really simple way of looking at this is that whenever a student analyses a chain of economic events it is crucial to clearly articulate any uncertain aspects relating to the outcome their analysis has predicted.
In an AS micro exam a simple and straightforward question might ask you to explain and evaluate why an increase in car sales might contribute to a rise in the price of oil.
Start with analysis and make sure you use a graph, label it accurately and explain all the steps involved stating with the initial equilibrium position and explain how the market transitions to the new equilibrium position.
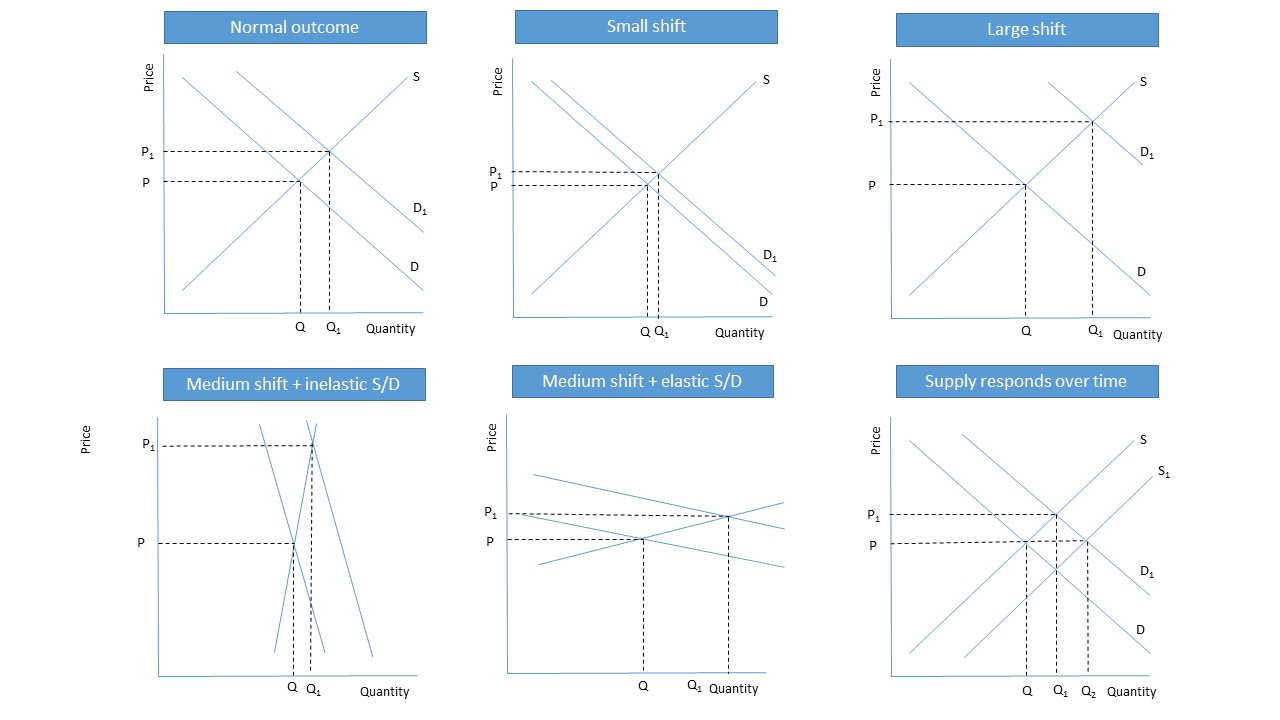
These diagrams illustrate the market for oil and some of the possible outcomes. Analysis should start with creating a graph like the one titled normal outcome followed by an explanation.
The market is initially in equilibrium at a price of P (step 1) where the quantity demanded and quantity supplied equal each other at Q (step 2). Due to the increase in the demand for oil due to a rise in car ownership (step 3) the demand for oil shifts outwards from D to D1 (step 4) this is because cars and oil are an example of joint demand (step 5). The initial shift creates excess demand (step 6) and this drives prices higher over time (step 7) until equilibrium is re-established at P1 Q1 (step 8).
To access higher grades you will need to evaluate your analysis:
Although the price of oil is expected to rise there is always uncertainty concerning how much and how quickly the price rise will materialise. For example, a small change taking some time to materialise may have limited impact on the price of oil (see small shift) while a large and rapid increase in car ownership could have a dramatic and more immediate impact on oil prices (see large shift).
You could develop this with some more detailed analysis and evaluation (this is the key to obtaining the highest grades). The timing and size of the changes will depend on a couple of factors:
- As the demand and supply of oil is relatively inelastic the changes in price are likely to be greater than the changes in output. There is an opportunity for further analysis here as you could draw an additional graph depicting inelastic demand and supply to illustrate the differential between price and quantity changes. You could also explain why the demand (oil is a necessity) and supply (it takes a long time to develop new oil fields) are inelastic (see difference between elastic and inelastic s/d).
- If the changes in car ownership take place over a relatively long period of time the impact on oil prices could be offset by suppliers recognising this change and increasing oil supply. This might have the potential to result in a downward movement in price as has been evident over the last 18 months (see supply responds over time).
You will notice that the are many terms used in this explanation (definitions are shown in the various light boxes). In an exam you should aim to define some of these terms.