
When resources are optimally distributed so that consumer surplus is maximised i.e. quantity demanded is equal to quantity supplied.
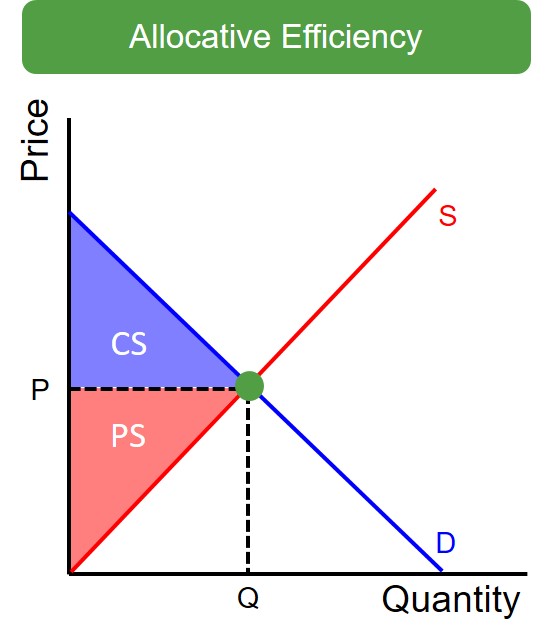
Below is a diagram to show the allocatively efficient point in a demand and supply context. At this point, resources are being distributed in the most efficient way and social welfare is maximised (producer surplus + consumer surplus). There is no other price that exists in which consumer surplus is maximised and no dead weight loss triangle is present at this point.
It is important to note that the position of the allocatively efficient point and whether it is achieved by the market will depend on the market structure that you are considering. For instance, in a monopoly market the allocatively efficient point will never be met as the firm has enough market power to extract as much profit from the consumers as possible - constraining consumer surplus and social welfare.
Allocative efficiency can also be highlighted by using a PPF diagram but only if further information about consumer preferences and tastes is made available. This is because there are many points that lie on the frontier and only one of these points can be allocatively efficient, as only one production point will satisfy consumer's preferences and produce the optimal allocation of resources, despite all production points on the frontier being productively efficient.