Economies of scale describes a process which causes average costs to reduce as scale increases. It will continue until output rises to a level at which capacity is fully utilised.
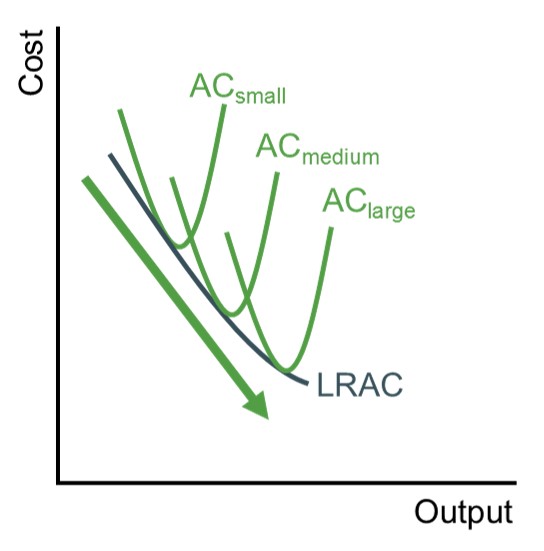
Below is a diagram to illustrate how economies of scale can be graphically represented for a firm. All average cost curves have a minimum point i.e. the level of output where average costs are minimised. The idea is that as the firm increases in scale the average cost curves begin to move down the LRAC curve and as a result the firm experiences lower costs as their output grows.