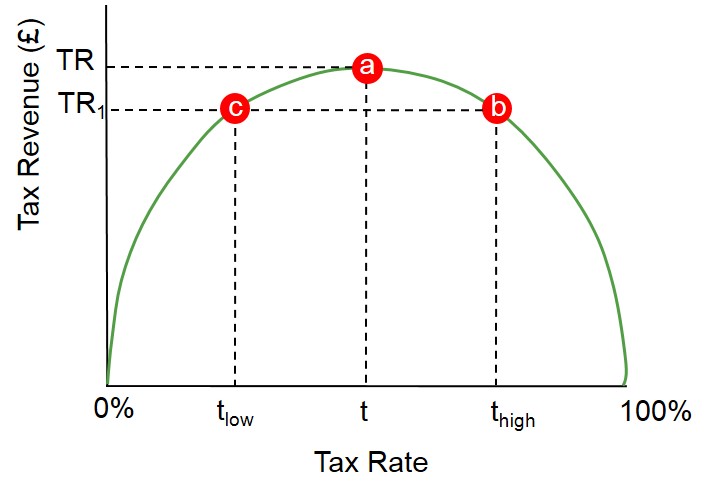
A curve showing how the amount of tax raised varies with the percentage rate of tax levied. It shows that although there is a positive relationship between the tax rate and revenue at low percentage rates of tax, the tax raised ultimately reduces when the percentage rate starts to rise to high levels, as this discourages workers from providing additional labour or encourages individuals to avoid paying the tax.
Below displays the typical shape of a Laffer curve and highlights that all economies have an optimal tax rate and this tax rate exists at point a in the diagram below. Perversely, in this instance if the tax rate is increased to point b the level of tax revenue falls, this is the key insight behind this curve. Because if the tax rate becomes too high workers lack the incentive to work.