
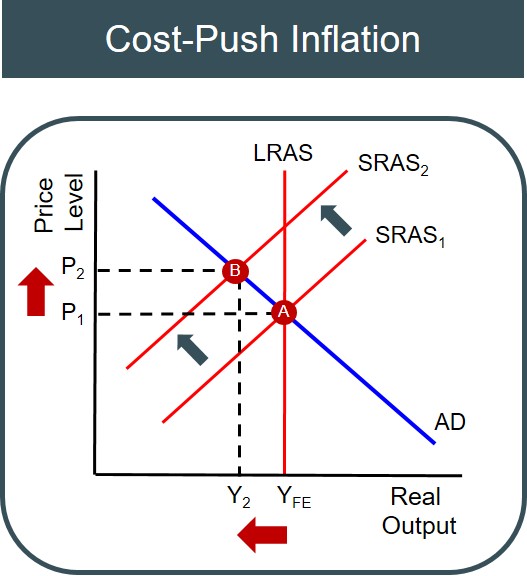
An increase in the price level due to an increase in production costs e.g. taxes, wages, utility or component prices. The cost increase will cause a negative shift in the SRAS curve. This causes prices to rise as costs push the supply curve up the aggregate demand curve.
Below is a diagram to show the impact of production costs rising over time, leading to a period of stagflation for the economy (inflation and negative growth). Generally it is any increase in factor of production cost that instigates the inward SRAS curve shift (increase in wages or higher prices for commodities such as oil). But there are also outside influences that could create this curve shift as well e.g. external inflation and higher taxes.
The factors that would create this type of inflationary pressure are:
- Increases in labour costs
- Increases in price of raw materials/commodities
- Increases in the cost of imports (weaker currency)
- Increases in the cost of capital
Because this type of inflation is brought about by production cost changes and not a stimulation in economic activity, it is perceived as the worst form of inflation an economy can experience when compared to consumption driven or investment driven inflation (demand pull inflation). This is because unlike with demand pull inflation, there is no opportunity for the LRAS curve to expand in the long-run to create disinflationary growth and return the economy back to full employment.
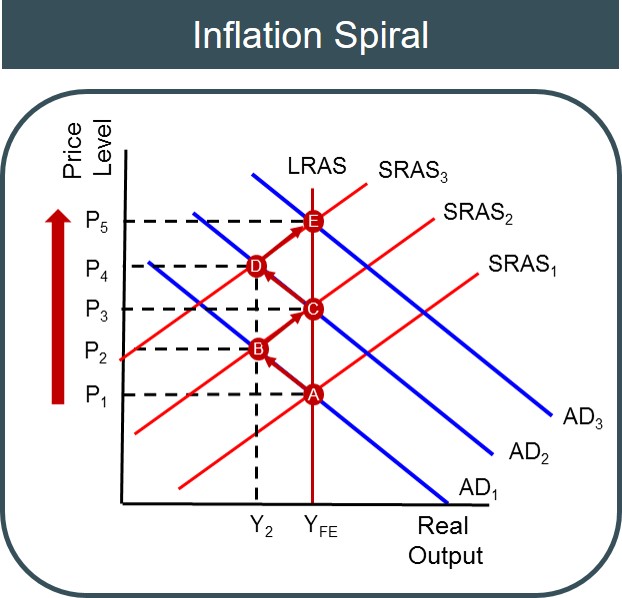
Cost push inflation can also lead to more severe changes in the price level if it is part of an inflationary spiral as shown below. This is created originally because of an increase in production costs moving the economy below the full employment and moving the economy to point B, as before. However, the rising costs of production can boost the disposable incomes of the owners of the factors of production (particularly if brought about by higher wages) which can result in an increase in spending and economic activity assuming ceteris paribus (depending on the marginal propensity to consume and save). This causes the AD curve to expand and moves the economy back to the full employment output level at point C. Crucially though, this leads to further inflationary pressures as the price level has now increased to P3. The spiral can then continue because if prices in the economy are increasing quickly, workers will bargain for higher wages to ensure in real terms they are made no worse off. This further increase in production costs for firms forces the SRAS curve inwards once again and a new macroeconomic equilibrium is settled at point D, stoking inflationary pressures even higher (P4). This process can continue and introduce crippling high inflation rates for a country.
An evaluation point to mention here is that if this type of inflation is sustained for a long period of time then it could damage the long term growth prospects of a country and in the process erode living standards.