Year 12 Recap - Supply Curves
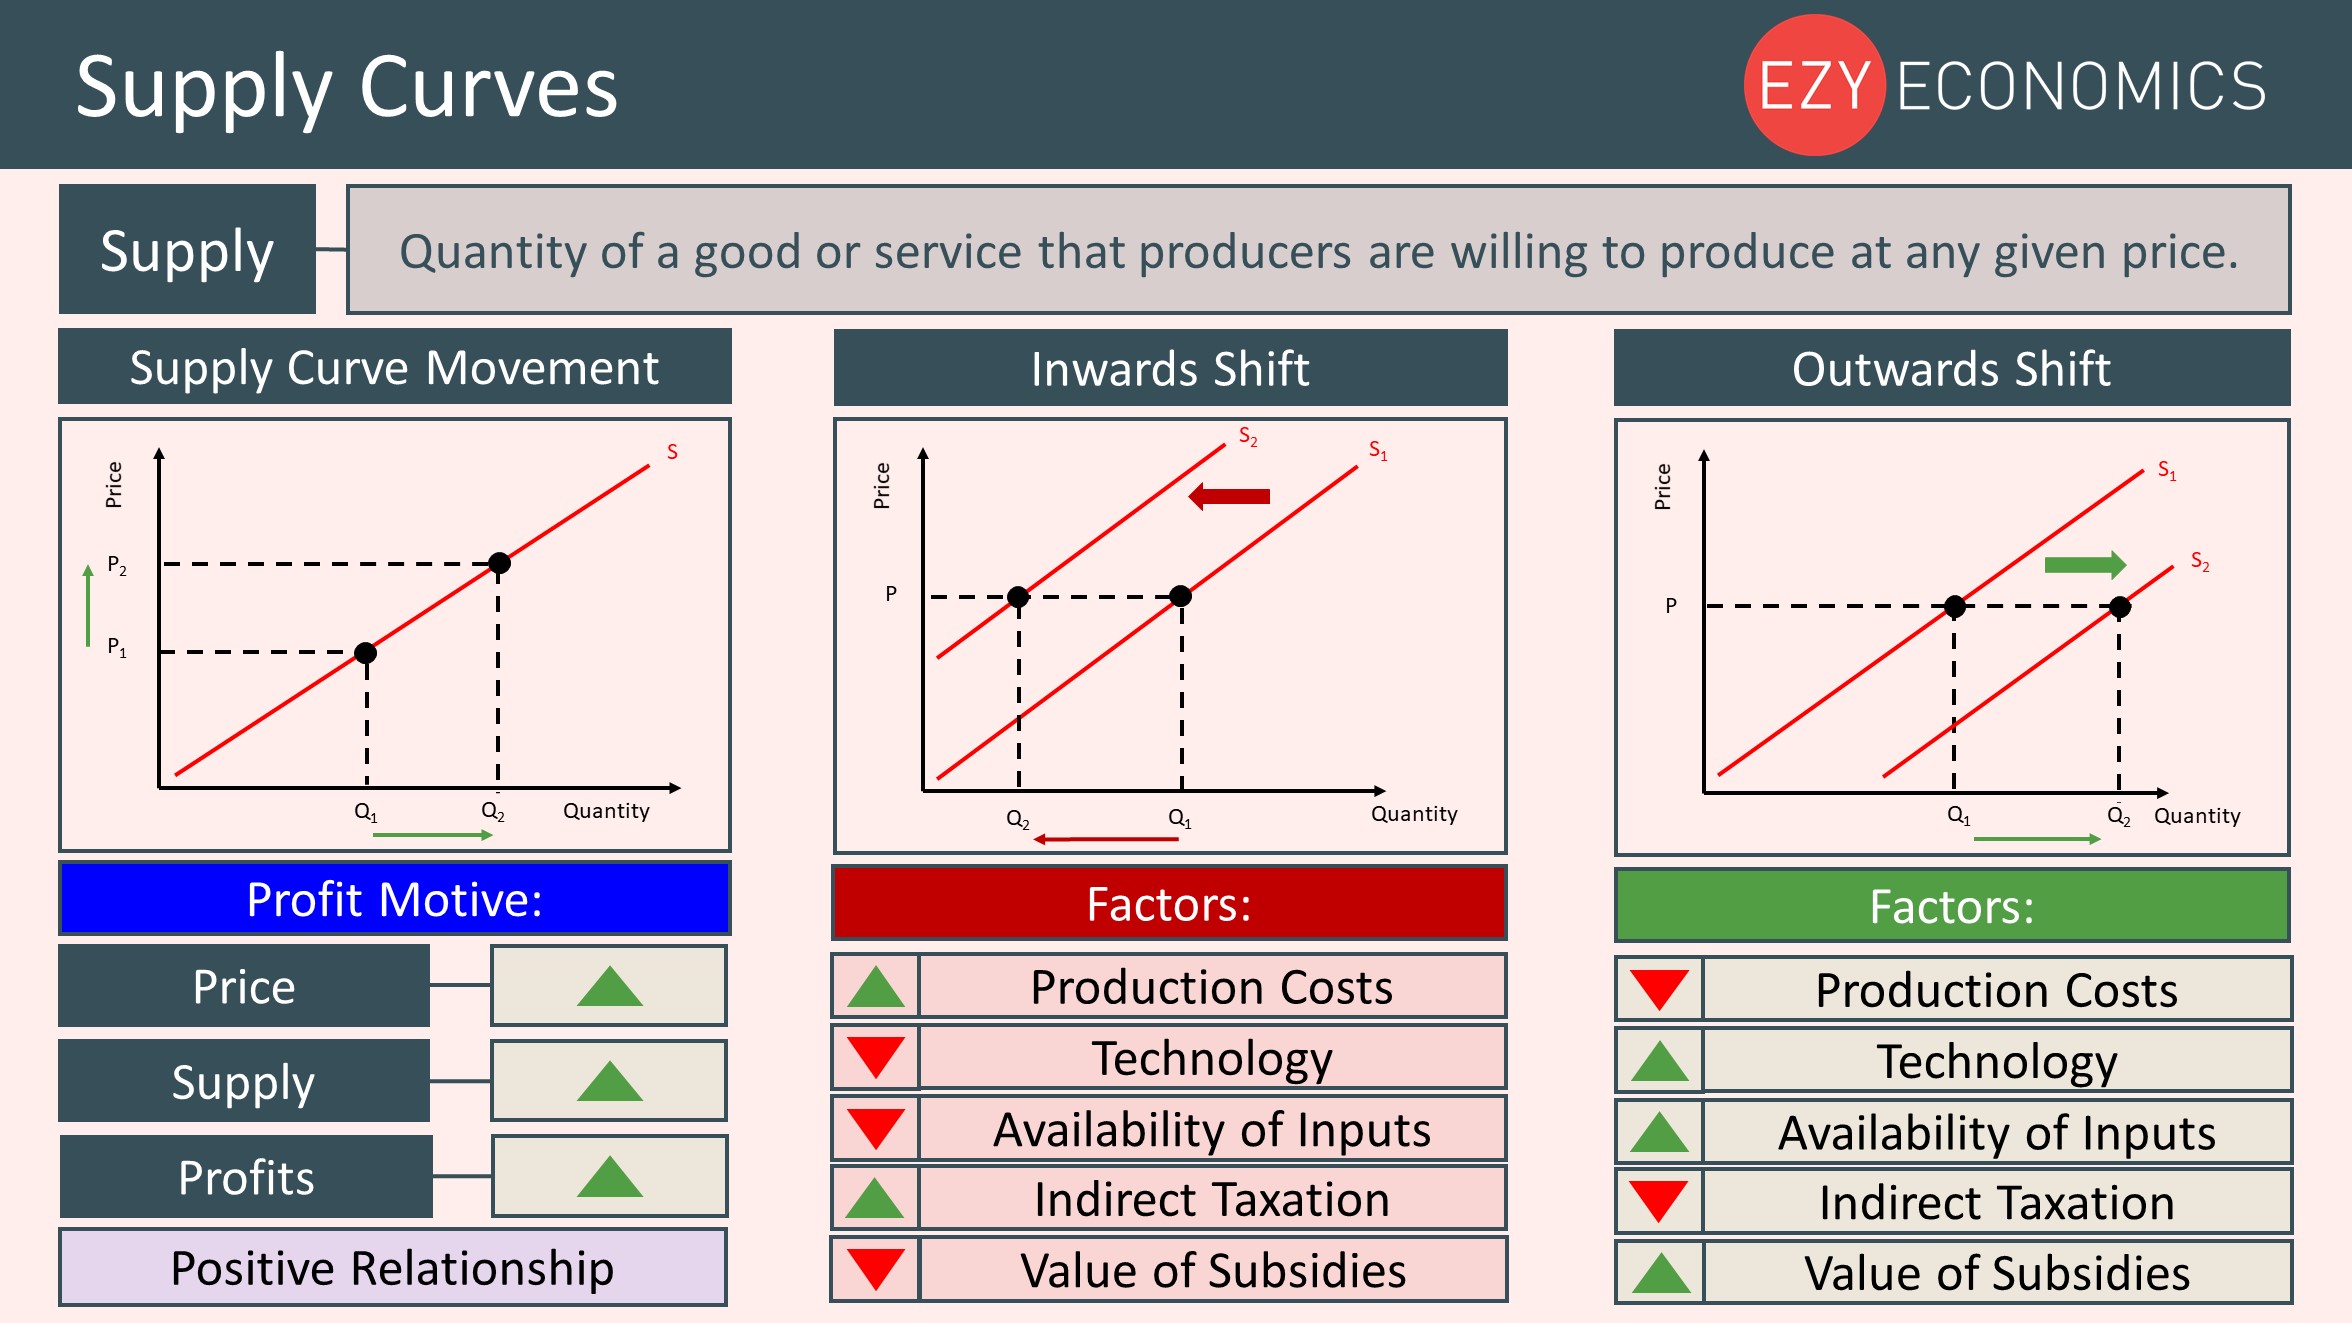
Today's Year 12 Recap is looking at the topic of supply curves. Supply curves provide economists with a graphical way of representing the quantity supplied of a good or service at any given price. Being able to understand the basic upward shape of supply curves and the distinction between a movement along the supply curve and a shift is a crucial skill amongst economists.
Supply curves are vital for demand & supply analysis - the core bedrock of many microeconomic essay responses. Understanding how a factor is likely to shift the supply curve for a market and being able to diagrammatically represent this is an essential skill.
Here Jack guides you around the topic:
Our Year 12 Recap is supported by awesome interactive revision mind maps. Find out more about them and how teachers and students can access them by clicking here.
EzyEconomics is the ultimate online A Level Economics support service. Schools can enjoy a free 30-day trial to see for themselves how EzyEconomics can support their teaching and help their students achieve better grades.