The EzyEducation website uses cookies to help ensure we give you the best experience.
If you continue without changing your settings, we assume that you are happy to receive all cookies on the EzyEducation website.
Please refer to our Privacy and Cookies Statement to

find out more.

Continue

Economic Terms

All   0-9   A B C D E F G H I J K L M N O P Q R S T U V W X Y Z

Quantitative Easing

The process by which central banks create new money to buy sovereign debt and other financial assets. This aims to stimulate economic growth by increasing credit available to individuals and firms, reducing the cost of new and existing borrowing and produce various wealth effects by increasing the value of financial assets.

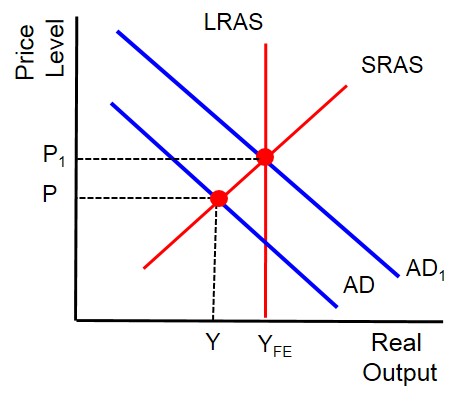
Below highlights the theoretical impact of QE into an economy with deficient aggregate demand. The purchasing of bonds makes credit cheaper and easier for business, individuals and households to acquire and therefore increases the amount of economic activity through business expansions and and house purchases. Ultimately, this contributes to a higher level of aggregate demand and despite introducing some inflationary pressures this is just moving the economy back to the full employment level. 

Quantitative Tightening

A policy that might occur after a period of quantitative easing if there are signs the economy is over-heating. It would involve the central bank selling the financial assets it acquired via quantitive easing to increase supply and reduce the value of these assets. It should help to slow economic growth and help control rising inflation as it will reduce availability of credit, increase borrowing costs and reduce the value of assets.

Below is a diagram to show how this policy works. In this instance, the central bank has already engaged in some form of QE and this has removed the negative output gap for the economy but has now created a positive output gap, putting the economy on an inflation alert. Therefore this policy aims to move the economy back to the full employment level of output to keep inflation in check and in line with the CPI inflation target. This is highlighted by a small inward shift of the aggregate demand curve to AD2. Restoring the economy to it's capacity.


Quantity demanded

The amount of a good or service consumers will buy at any given price.

Below is an illustration of a typical downward sloping demand curve. This shows that when the market price for a particular good begins to fall this causes the quantity demanded for that good to rise. This is often known as the Law of Demand and why demand curves for conventional goods always have a negative slope.


Quantity supplied

The amount of a good or service firms plan to supply to the market at a given price.

Below is an illustration of a typical upward sloping supply curve. This shows that when the market price for a particular good begins to rise this causes the quantity supplied for that good to rise. This is because firms have a profit incentive to sell more goods at higher prices. But also if they are to produce more goods, production costs rise in line with that and therefore they have to charge a higher price to maintain margins.


Quasi public goods

Goods that have the feel of public goods but do not completely satisfy the definition of a public good. They are largely non-rival (apart from during peak/times and periods) and it is possible to exclude third parties from the benefits but the costs associated with this mean that this is rarely enforced. e.g. roads and NHS.

Quick Ratio

Refines the Current Ratio by measuing the amount of the most liquid current assets there are to cover current liabilities. This helps avoid the problem of the Current Ratio as it only includes the most liqiuid assets. Generally speaking the higher is the ratio the safer the bank is perceived to be.


Display # 
Forgot your password?