The EzyEducation website uses cookies to help ensure we give you the best experience.
If you continue without changing your settings, we assume that you are happy to receive all cookies on the EzyEducation website.
Please refer to our Privacy and Cookies Statement to

find out more.

Continue

Economic Terms

All   0-9   A B C D E F G H I J K L M N O P Q R S T U V W X Y Z

Immobility of factors of production

When factors of production cannot be easily applied to another use e.g. a hospital cleaner would not be able to be reassigned to perform heart surgery or it may not be easy to encourage unemployed Spanish workers to fill vacancies in Germany.

Imperfect competition

A market where a small number of large suppliers can set the prices for their products.

Imperfect information

Where either firms or individuals are not aware of all the information that is relevant to make decisions about the supply and consumption of products. The most commonly used example of this is the secondary cars market, in which car buyers cannot determine whether the cars they are being sold are of good quality or of bad quality (lemons). This is a specific form of imperfect information called adverse selection.


Imports

Goods made abroad that are purchased in the UK - any transaction that generates a negative monetary flow out of the UK e.g. money spent on iPhones or foreign holidays.

Below is a graphic that shows imports represent a leakage out of the circular flow of income/expenditure in an economy. This is because money flows from domestic residents to foreign companies that produce these imported goods.

Therefore imports negatively contribute to the aggregate demand curve and if imports increase due to a stronger pound sterling then it will cause the AD curve to shift inwards as net exports for a country falls as shown in the diagram below.


Incentive function of prices

Prices incentivise and influence the decisions of consumers and producers e.g. higher prices encourage production but discourage consumption.

Incidence of tax

A way of analysing how the impact of an indirect tax is shared between consumers and producers. The elasticity of the demand curve affects how much of the tax is passed onto consumers.

Below is a diagram to illustrate how the imposition of an indirect tax implaces a burden on consumers. In this instance the demand curve is neither inelastic or elastic and therefore the tax burden is split evenly between the consumers and producers.

Below is a diagram to illustrate when the demand curve is inelastic and therefore the tax burden is split unevenly towards consumers ahead of producers.

Below is a diagram to illustrate when the demand curve is elastic and therefore the tax burden on consumers is small.


Income

The money earned by factors of production over a period of time e.g. rent, interest, wages and profit.

Below is a table to highlight the four factors of production that go towards producing goods and services in an economy and the accompanying money I would earn.


Income effect

When the quantity demanded changes following a price change if consumer real incomes remain the same i.e. if real income remains constant and prices increase it will not be possible to purchase the same quantity of goods.

Income elasticity of demand

This measures the proportionate change in the quantity demanded of a good in response to a proportionate change in income. Essentially, it is a useful way of measuring the responsiveness of a change in the amount of a good demanded as a result of a change in their personal income. This is an important elasticity measure as income is one of the main driving forces behind consumption patterns of goods.

Below is the formula for calculating YED:

If the YED value is positive we classify the good in question as a normal good and therefore is a good that consumers enjoy to consume and wish to consume at higher quantities the more income is at their disposal.

If the YED value exceeds 1 we can classify the good as a luxury good as this is a good that would require a large swing in income to either encourage the consumer to purchase it in the first place or to stop consuming it and replace it with a good that is cheaper. 

If the YED value is negative we can classify the good in question as an inferior good. This is because if a person's income falls then the quantity demanded of these inferior goods increases as consumers switch expenditure away from normal goods to cheaper alternatives.


Income Inequality

The distribution of income is a measure of the share of income that is distributed across the population of a country. 

An unequal distribution of income is often a characteristic of modern day economies as a perfectly equitable distribution is impossible to achieve. This is because there is no economy in the world by which a perfectly equitable distribution of income can be achieved. This is because in the free market, workers always have the incentive to work harder by being rewarding with higher levels of pay and therefore it is this that drives the income inequality within a country. However, the degree and extent of income inequality varies between countries all on the basis on different levels of economic development, public service access, political and social structure as well as the cultural identity of a country. 

In theory vast amounts of inequality are bad for a country as it negatively impacts individuals standard of living, by damaging their aspirations, opportunities and income. This is compounded by the fact that these individuals will have limited access to the crucial public services within a country such as sufficient levels of healthcare and further education. The economic consequences of this is that it can damage the level of human capital established across the economy, shrinking the quality and quantity of the factors of production and ultimately damaging the productive capacity of the economy, as well as the long-run trend growth rate of a country. 

But despite all of these economic issues created by an unfair distribution of income, governments are never searching for a distribution of income that is perfectly equal as this is not always a sign of a growing and developing economy. This is because an unequal distribution of income could be a sign of economic prosperity that has possibly been brought about by entrepreneurial innovation. Governments therefore accept that a degree of inequality for a country is not always a particular weak feature of the economy as long as it is controlled and has been created via a productive and sustainable way. 

Therefore a good evaluation point to consider is that if the incentive of being rewarded with higher incomes was no longer present in the labour market, then surely an economy would be worse-off despite the fact that theoretically the distribution of income would be fairer, because the positive benefits of individuals striving for a better standard of living will be lost. Therefore, it is up to the government to be able to identify whether a worsening in the distribution of income is a fair reflection of the effort and contribution that certain individuals have made to the economy over time. 

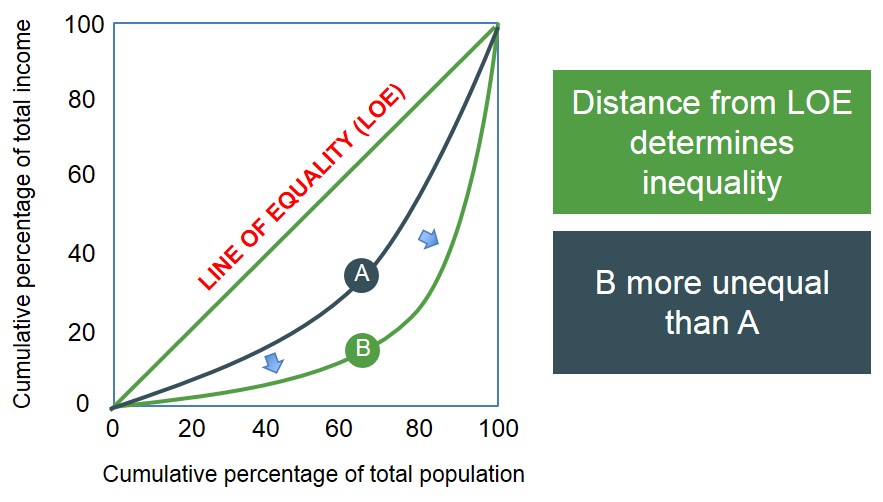
One of the most commonly used methods of measuring the income distribution for a country is to analyse the Lorenz Curve. Below is a diagram which illustrates the income distribution for a country worsening as the Lorenz Curve has shifted out to B. This means that a bigger fraction of income is held by a smaller percentage of people i.e. the very wealthy. Likewise it is the opposite for an inwards shift of the curve. From this measure the Gini Coefficient can be derived, placing the measure of the income inequality of a country into one single figure.

However, despite the measures being simple and intuitive to look at and analyse in theory, they do contain a significant amount of limitations which restrict the ability to accurately reflect the true picture of the distribution of income in a country.  Some evaluation points you could mention are:

  • Limitations behind cross-country comparisons i.e. cannot compare the inequality measures of a developed country in sub-saharan Africa with the inequality measure of a developed country in Europe.
  • Limitations when drawing conclusions about the level of economic development in a country i.e. some countries like the US have high levels of income and development but also a reasonably high level of income inequality.
  • Limitations of the use of inequality measures because of issues regarding data availability and reliability. 
  • Inequality measures are too narrow and often oversimplified and therefore may not provide a true reflection of the distribution of income within a country e.g. does not take into account age distribution or the current level of government policies.  

Display # 
Forgot your password?