The EzyEducation website uses cookies to help ensure we give you the best experience.
If you continue without changing your settings, we assume that you are happy to receive all cookies on the EzyEducation website.
Please refer to our Privacy and Cookies Statement to

find out more.

Continue

Economic Terms

All   0-9   A B C D E F G H I J K L M N O P Q R S T U V W X Y Z

Labour

The human capital applied to the production process in return for wages i.e. the workforce of an economy. This includes the physical and mental efforts that workers put into the production process.


Labour force

Is a collective measure for all of the workers who are able and willing to work i.e. sum of the individuals who are either employed or unemployed. This is one of the best measures of the strength of the labour market of a country.


Labour force survey

A quarterly survey of the UK labour market completed in accordance with internationally agreed standards. It is a wider measure of unemployment than the count of the number of people receiving Job Seekers Allowance and provides far more detailed view of employment in the UK in a format that facilitates accurate international comparisons.

Below is the LFS measure of the UK unemployment rate from 1971-2014.


Labour hoarding

Is a term that describes the employment practice of firms keeping workers on the payroll despite an economy going into recession. The decision is made to keep these workers so that firms can quickly regain profitability when the economy recovers. The firm sacrifices profit during the period in which the economy is in recession, so that they can recoup the lost profits when recalling the workers. This is because the workers are already experienced in the environment of working in the company so they can move back into the company seamlessly. therefore, the firm avoids the costly training process of hiring new recruits. This is a strategy that is predominantly used with firms that provide jobs that require a lot of training for the workers.


Labour market imperfections

Aspects of the labour market which causes the prevailing wage rate to lie above or below the equilibrium wage rate. As a result markets will fail to achieve efficient outcomes.

Below is a diagram to show a wage rate that is forced above the equilibrium wage rate creating excess supply classical unemployment. This could be caused by lots of factors such as imposition of a minimum wage, trade union intervention, lower welfare benefits or sticky wages.


Labour Productivity

The amount of output per unit of labour.

Below is a diagram to show the growth in UK labour productivity since 1960. It has been growing close to a linear trend.

Source: ONS


Laffer Curve

A curve showing how the amount of tax raised varies with the percentage rate of tax levied. It shows that although there is a positive relationship between the tax rate and revenue at low percentage rates of tax, the tax raised ultimately reduces when the percentage rate starts to rise to high levels, as this discourages workers from providing additional labour or encourages individuals to avoid paying the tax.

Below displays the typical shape of a Laffer curve and highlights that all economies have an optimal tax rate and this tax rate exists at point a in the diagram below. Perversely, in this instance if the tax rate is increased to point b the level of tax revenue falls, this is the key insight behind this curve. Because if the tax rate becomes too high workers lack the incentive to work.


Land

The factor of production that not only covers land but also the sea and anything that can be extracted from it (mining and fishing) or produced using the land (farming and forestry). It does not include any property built on land. Rent is the reward paid for the use of this factor of production.

Law

A theory that is supported by extensive empirical research.

Law of Demand

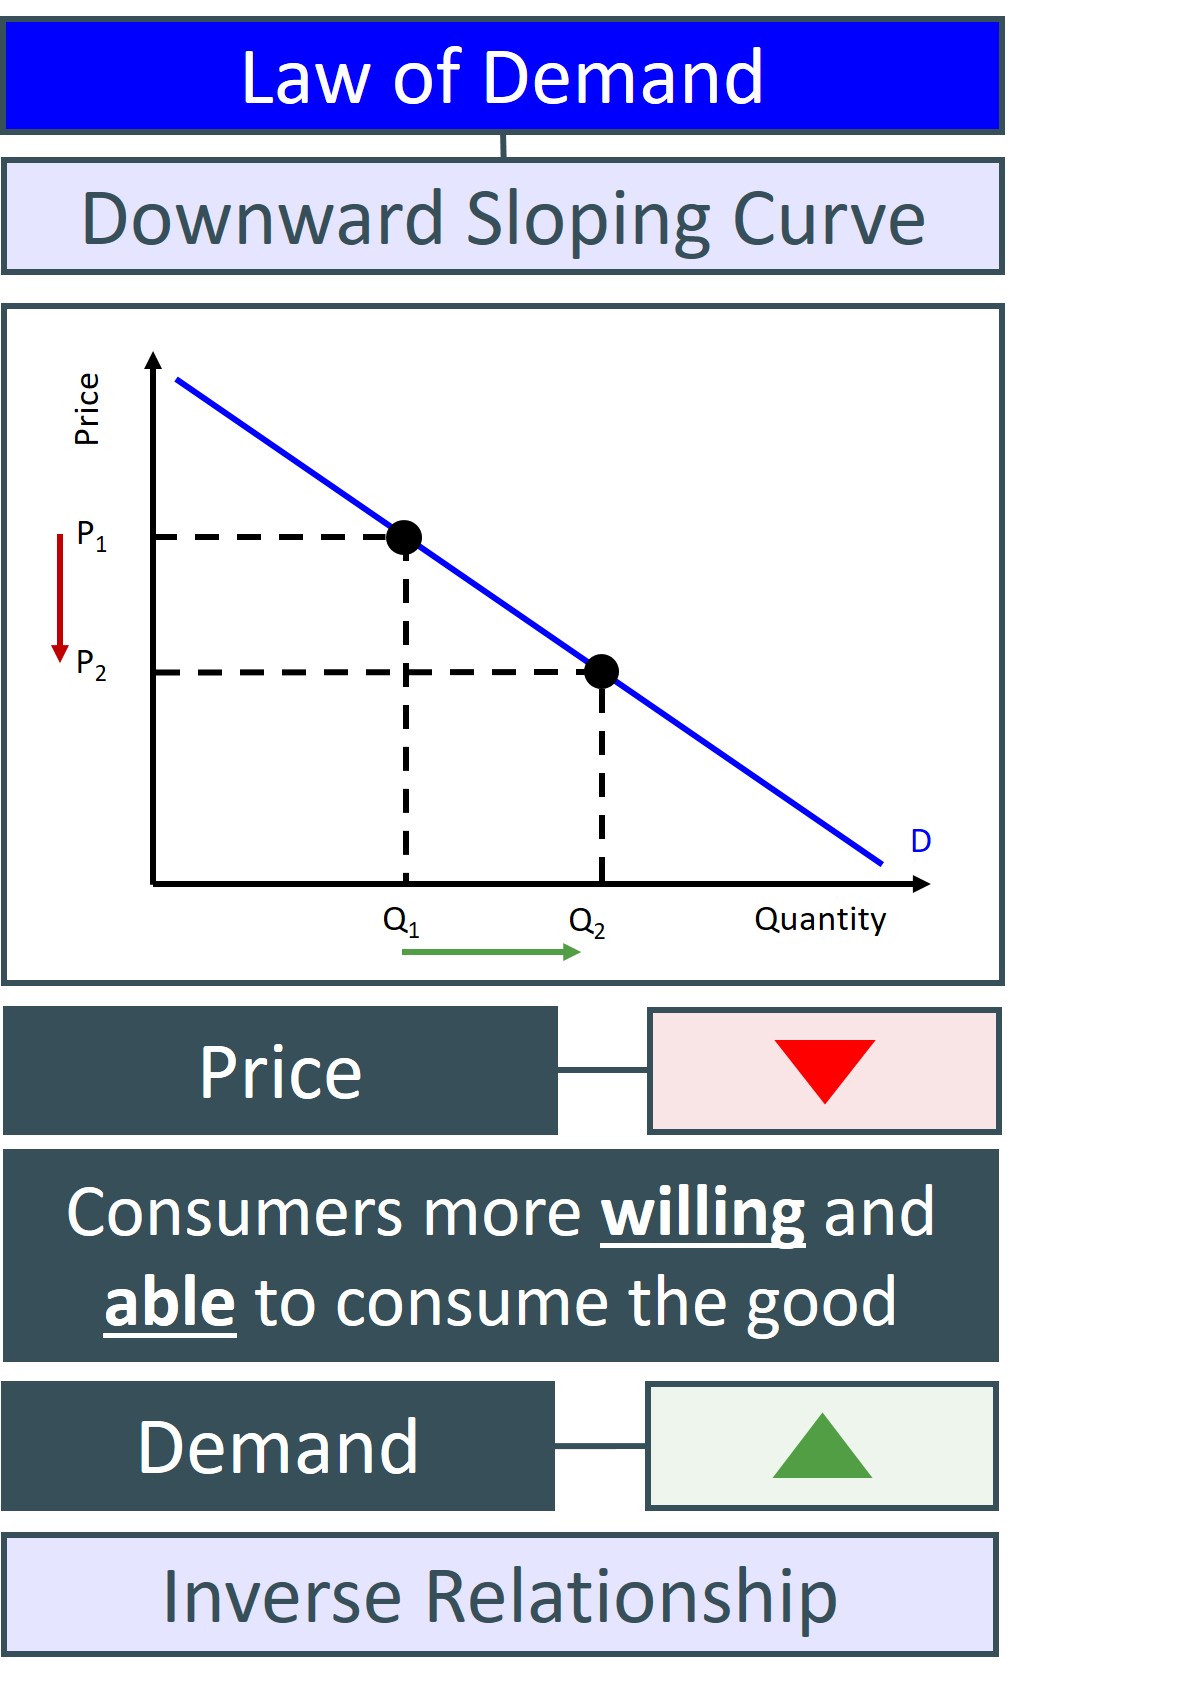
This is the theoretical explanation of why the demand curve for most goods and services is downward sloping i.e. an inverse relationship between the price of a good and the quantity demanded of that good.

This is best explained by the fact that when there is a change in the price of a good it affects the ability and willingness of individuals to consume the good at the new price. For instance, if the price of the good falls, more individuals are able to consume the good as it now fits into their affordability range. Also, some consumers that could afford the good before the price change, but were not willing to purchase the good at the original price because it was beyond their own value placed on the good, may well be incentivised and encouraged to purchase the good at the new lower price. The combined effect of these two consumption channels leads to the quantity demanded for the good or service in question to increase in response to a price fall. 


The only case the law of demand does not hold for a particular good is when we are considering a veblen good. In this rare and often theoretical case, demand actually rises with the price of the good.


Display # 
Forgot your password?