The EzyEducation website uses cookies to help ensure we give you the best experience.
If you continue without changing your settings, we assume that you are happy to receive all cookies on the EzyEducation website.
Please refer to our Privacy and Cookies Statement to

find out more.

Continue

Economic Terms

All   0-9   A B C D E F G H I J K L M N O P Q R S T U V W X Y Z

Liquidity Crisis

Is when a bank's balance sheet is in a position of a large liquidity mismatch. This can occur because of the liabilities maturing earlier than the assets and therefore bank's are left with no option but to sell their assets off at a firesale price prompting fears of a bank run and ultimately, if severe enough, can lead to bankruptcy.

Below is the logical sequence of reasoning for a liquidity crisis to summarise the main stages at which it occurs inside a bank's balance sheet.


Liquidity Trap

Is a term associated with John Maynard Keynes defining situations where injections of new money into the banking system (e.g. quantitative easing) fail to stimulate lower interest rates and economic growth because economic agents hoard the extra cash and don’t spend it.

Loan (Advance)

When a bank channels funds from savers to borrowers. The borrowers are deficit units - total expenditure exceeds total income - and require borrowed money from the bank to meet their spending plans. The loan requires borrowers to contractually pay back periodic payments linked with a specific interest rate to help banks make profit.

Below is the flowchart to illustrate how money flows from savers through the bank to borrowers.


Long run aggregate supply curve

The total productive capacity of an economy. It is equal to the full employment level of real output and is vertical at the point of full employment.

The LRAS curve illustrates that in the long-run unless there is a change in the size or productivity of the factors of production employed, supply will always exist at the full employment level and will not vary with price, as the economy is at full capacity. The diagram below highlights the typical shape of an LRAS curve.


Long-run

When all factors of production are flexible i.e. the business is able to change capital and land when they wish to do so.


Long-Run Phillips Curve

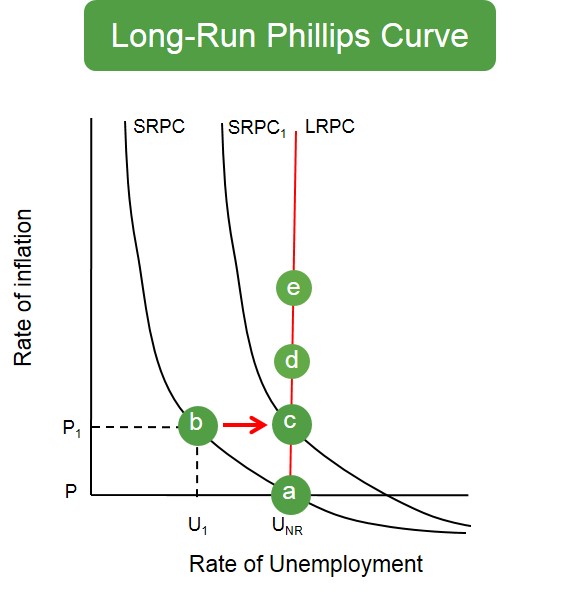
This curve is a straight vertical curve and shows that no matter the rate of inflation, in the long-run the rate of unemployment is consistently the same. In other words, in the long-run there is no trade-off between inflation and unemployment

Below is a diagram to show how the long-run version of the Phillips curve is formed. An expansion in AD creates economic growth and reduces unemployment below the natural rate of unemployment and this moves the economy to point B as jobs are created in the short-term. However workers now have more bargaining power, workers demand higher wages and this forces production costs up to a new higher level for firms, these then eventually get passed on as higher prices. Eventually in real terms nothing changes as the economy ends up at the natural rate of unemployment but just with a higher level of inflation. This is shown by the upwards shift of the short-run Phillips curve. This process continues to repeat itself with the only substantial effects being inflationary effects. Therefore the LRPC is derived from the continual shift up in the SRPC due to economic agents rational expectations.


Long-term trend growth

The long term direction of output growth assumed to represent the productive potential of an economy.


Loose monetary policy

Policy decisions designed to reduce the cost of credit and stimulate AD i.e. to counteract deflationary possibilities.

The diagram below illustrates the most common form of loose monetary policy which involves cutting the base rate and injecting some level of economic activity into the economy. It does this by making credit to businesses and consumers from bank's easier to obtain.


Lorenz Curve

A graph which indicates the level of income inequality for a country by plotting the cumulative percentage of total national income against the cumulative percentage of the corresponding population.

Below is a table and diagram to illustarte how the lorenz curve is formed. The Lorenz curve bends away from the x axis as generally the bigger the population segment the bigger the percent of total income belongs to them. But the closer the curve is to the line of equality (income is equally distributed amongst all income groups) the fairer the distribution of income across the country. Likewise the more bowed out the lorenz curve becomes the more unequal the distribution is as a very samll percentage of the population holds majority of the income of a country.


Display # 
Forgot your password?