An increase in the price level due to a positive shift in the aggregate demand curve i.e. prices rise as demand pulls the AD curve up the supply curve.
The increase in AD can arise from any positive changes in: consumption, investment, government spending or net exports.
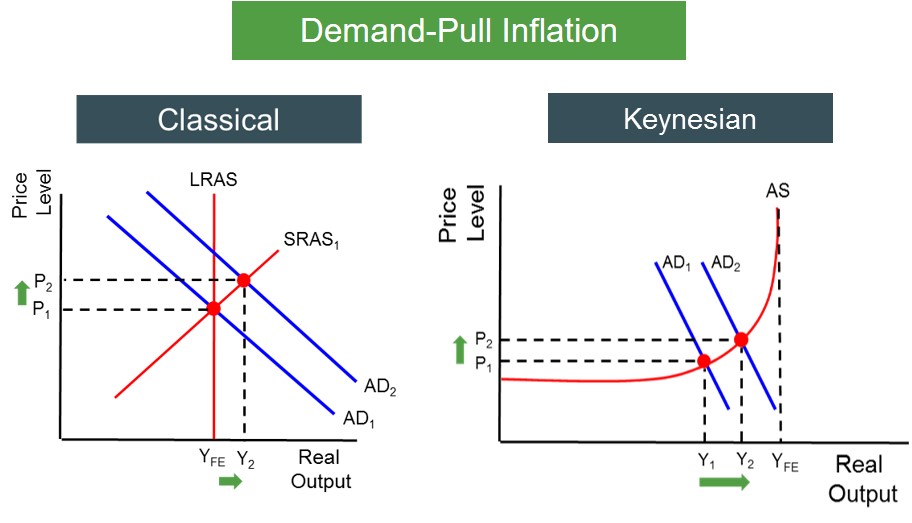
Below is a set of diagrams to highlight the two different approaches to showing demand-pull inflation in an economy. The Keynesian AS curve provides a clearer path to evaluating the impact of demand curve shifts on the inflation rate. In the classical case, the inflation is created by an outward AD shift with no change in the SRAS curve assuming ceteris paribus.
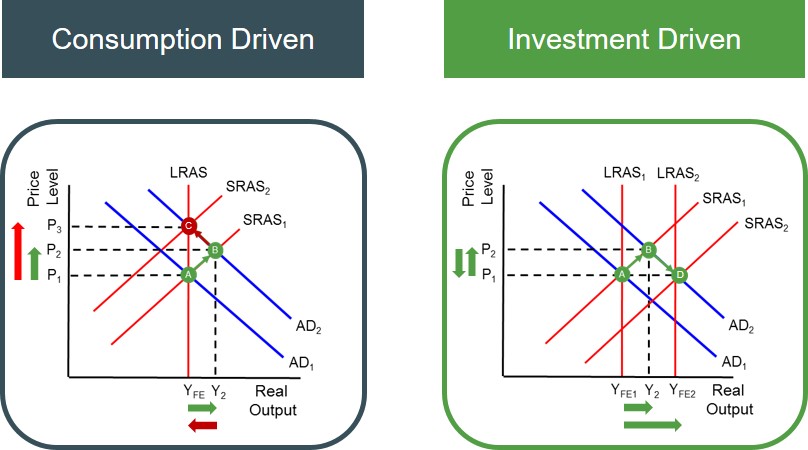
However, when evaluating this type of inflation it is important to understand the main cause of the positive AD shift. This is because if the AD shift was caused by increased consumption brought on by higher consumer confidence, then it is likely to create an inflationary spiral, in which real output remains unchanged but the price level increases significantly. This is essentially an inflationary movement up the LRAS curve without any real gains for economic agents. However, if the AD curve shift was brought about through higher investment, this is likely to have strong productivity links to the economy (e.g. increase in rate of capital accumulation). As a result, it can create pressure for the LRAS curve to outwardly shift and the economy goes through a period of disinflationary growth. So it is important to consider what factor has driven the demand-pull inflation to evaluate its impact on the performance of the economy.
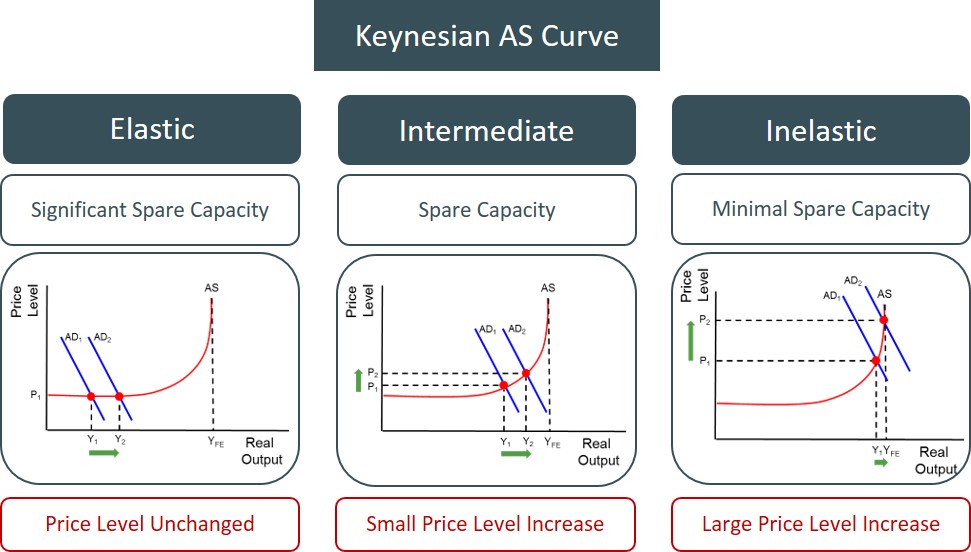
Also the degree and extent of demand-pull inflation introduced in the economy from an AD shift depends crucially on the level of spare capacity in the economy. This Is because if an economy is at or close to full capacity, majority of the economic resources (e.g. factors of production) are in use. Therefore, any increase in demand creates pressure on an economy's existing endowment of resources to produce a higher level of output. It is this that creates the inflationary pressure for prices to rise as factors of production demand higher rewards for the increase in effort and work they have to put in to produce the extra output. This causes the economy to overheat and creates significant rises in prices.
However, when an economy has a significant level of spare capacity (significant amount of unemployed resources) an increase in demand and output does not put pressure on the existing set of resources currently employed, as firms can increase the amount of economic resources they employ in their production to fuel the higher output. This means the strain on the economy is lessened and the inflationary pressures are not as severe. This explains why the Bank of England closely monitor labour market data when making a decision on setting the base rate, in order to control inflationary pressures (e.g. the lower the unemployment rate, the greater the chance an increase in economic activity stokes inflation).
To illustrate the impact of spare capacity on inflationary pressures, it is best to use the Keynesian AS curve.