The EzyEducation website uses cookies to help ensure we give you the best experience.
If you continue without changing your settings, we assume that you are happy to receive all cookies on the EzyEducation website.
Please refer to our Privacy and Cookies Statement to

find out more.

Continue

Economic Terms

All   0-9   A B C D E F G H I J K L M N O P Q R S T U V W X Y Z

Indirect taxation

Taxes that are imposed on transactions. e.g. VAT, fuel duty, insurance premium tax.

Indirect taxes

Taxes that are imposed on transactions. e.g. VAT, fuel duty, insurance premium tax.

Individual demand

The demand for a good/service from an individual consumer or firm.

Indivisibilities

This is a technical economy of scale. Many economies of scale can only be captured by using large items of equipment that must be continuously used to full capacity. This means that smaller suppliers can’t access the same economies of scale if the equipment isn’t available on a smaller scale.

Inelastic demand

When the percentage change in demand is less than the percentage change in price. In this case the PED elasticity value will lie between 0 and -1.

To identify the shape of an inelastic linear demand curve we do not focus on the gradient of the curve as this does not actually determine elasticity. Crucially, it is the position of the demand curve that determines elasticity. This is because all linear demand curves contain portions on the curve which can be classed as elastic, inelastic and unit elastic. Any demand curve shown (like the one below) is just a section of a much larger demand curve that extends beyond the axis.

So effectively we can see that the midpoint of the demand curve is when unitary elasticity is achieved. The bottom half of the curve is inelastic, because if the price rises - at any point below the midpoint - expenditure increases despite a quantity fall. The top half of the curve is elastic, because if the prices rises - at any point above the midpoint - expenditure decreases due to a large quantity fall.

Therefore, the easiest way to determine an inelastic demand curve is to extend the section of the demand curve drawn and identify which axis it intersects. If the demand curve intersects the x axis we can judge it as being an inelastic demand curve as we must be focusing on the bottom of the demand curve. An example of an inelastic demand curve is shown below.

This diagram highlights the changes in expenditure for a producer that occurs when there is a small price rise in a market with inelastic demand. When a demand curve is relatively inelastic, it means that consumers are price insensitive to changes. In this instance, a price rise leads to a small fall in demand as consumers refuse to switch to alternative cheaper substitutes


Inelastic Supply

When the proportionate change in supply is less than the proportionate change in price. In this case the PES elasticity value will be below 1.

Below is an example of an inelastic supply curve:

The supply curve has the typical upward sloping relationship between price and quantity supplied because the profit incentives that firms face are greater when the price increases. However, with an inelastic supply curve firms ability to raise output in line with a price increase is restricted due to a number of different factors. Which is the main reason why with this type of supply curve the change in the quantity supplied is proportionately less than the price.

These factors are:

1. Amount of Spare Capacity - If a firm has very little spare capacity left, they will not have the sufficient resources to increase output when the price rises.

2. Length of Production Process - If a firm is producing a good that has a long production process their ability to respond to price increases by raising output is restricted as they are unable to raise supply within a short period of time. This is often the case in agricultural markets.

3. Factor Substitutability - A firm will always wish to produce the good that has the highest price, as this is the good that will yield the highest level of profit. However, if firms are unable to transfer their factors of production towards different production processes, this ability to increase output in line with prices is restricted.


Inferior good

A type of good where demand for the good decreases as INCOME rises e.g. own value brand products.

Below is a diagram to illustrate the basic demand curve structure for an inferior good. If the level of real income increases this causes an inward shift of the demand curve as consumers disposable income increases they switch to better quality products that they derive a greater level of utility from. Vice versa if the level of real income decreases this causes an outward shift of the demand curve as consumers can no longer afford normal goods and therefore they switch to cheaper alternatives which are of inferior quality. 


Inferior goods

A type of good where demand for the good decreases as income rises e.g. own value brand products.

Below is a diagram to illustrate the basic demand curve structure for an inferior good. If the level of real income increases this causes an inward shift of the demand curve as consumers disposable income increases they switch to better quality products that they derive a greater level of utility from. Vice versa if the level of real income decreases this causes an outward shift of the demand curve as consumers can no longer afford normal goods and therefore they switch to cheaper alternatives which are of inferior quality. 


Inflation

A persistent rise in the price level within an economy over a period of time. As a result this causes the value of money in the economy to fall, as each unit of currency now buys fewer goods and services.

It is important to note that inflation in a country can be either rising or falling. But as long as the inflation rate remains positive, it can still be classed as inflation as overall the price level is still rising from one period to the next, but crucially not as significantly as the previous period. Falling inflation is called stagflation. Whilst a negative inflation rate is classed as deflation because the general price level falls from one period to the next with a negative rate.

A country's inflation rate is calculated by using a weighted price index (e.g. UK Consumer Price Index) that measures the changes in prices of the everyday goods and services that the average household consumes. It is a weighted index as greater weights are attached to the most popular goods, as price changes in these types of goods will impact households more than luxury items. The inflation rate is then measured by calculating the percentage in this weighted index from one period to the next. 

Inflation in an economy can either be classed as demand pull inflation or cost push inflation. Below is a summary of the AD-AS impact of these two types of inflation.

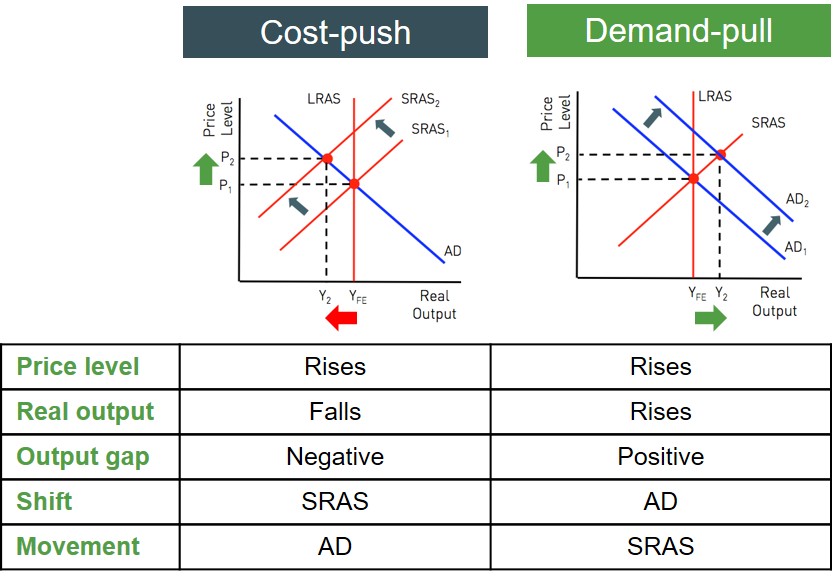
Both of these types of inflation push the price level up as a result of a macroeconomic disequilibrium and this in turn creates an output gap. Therefore in an exam question it is important to evaluate what is the cause of inflation in an economy and from that you can assess how large an impact this factor has had on the inflation rate i.e. has it caused the inflation rate to increase rapidly or insignificantly. This is important as from this initial evaluation point you can argue and discuss the possible economic policies that may be implemented in response to the inflation rate rising too quickly, in order to protect a country's competitiveness.

Inflation is predominantly used as an indicator about the overall strength and health of an economy as it highlights that the confidence amongst consumers and businesses is high and the labour market is in a strong and robust position. However, if inflation becomes too high then it can create uncertainty and can potentially destabilise the whole economy as money loses its value very quickly. This is known as hyperinflation and is a common problem in developing countries that run infeasible economic policies. As a result, most countries use an inflation target to keep the inflation rate within a narrow range of values. This inflation target is set at a moderate level with higher and lower bounds to ensure macroeconomic stability is in tact. In the UK the Bank of England set a CPI inflation target of 2%.

Inflation can be good and bad for an economy. Some of the benefits are: It can increase confidence and spending, reduce the value of borrower's debt burden, increase business production and reduce real wage costs for businesses. But despite those benefits it can be argued that inflation can be damaging to an economy as it creates uncertainty, lowers capital accumulation, increases menu costs and negatively impacts savers/lenders.

Overall, inflation is a very important discussion point in an exam as the level of inflation in an economy changes when the AD or SRAS curves shift. You will then be required to evaluate the extent of the inflation change by looking at factors such as:

  • The size and significance of the curve shifts
  • The sustainability of the shifts (short run and long run impact)
  • The level of spare capacity in the economy
  • The level of volatility of the inflation rate (the likelihood of creating uncertainty)

Inflationary output gap

When the price level rises as a result of an output gap arises due to a positive shift in AD (positive output gap) or negative shift in SRAS (negative output gap).

The diagrams below illustrate the two main types of inflationary pressures caused by the persistence of an output gap. The left-hand side diagram represents cost push inflation and the right-hand side diagram represents demand pull inflation.


Display # 
Forgot your password?