The EzyEducation website uses cookies to help ensure we give you the best experience.
If you continue without changing your settings, we assume that you are happy to receive all cookies on the EzyEducation website.
Please refer to our Privacy and Cookies Statement to

find out more.

Continue

Economic Terms

All   0-9   A B C D E F G H I J K L M N O P Q R S T U V W X Y Z

Pareto efficient point

The best outcome that can be achieved e.g. any point on a PPF, the lowest point on an AC curve, the equilibrium point an a demand/supply graph.

Partial market failure

A market exists but too much or too little of a good or service is produced.

Partial model

A model that explains economic activity using a small number of variables.

Patent

A patent provides an inventor the exclusive right to produce a good or service for a certain period subject to full disclosure of the invention. This establishes monopoly powers for the duration of the patent.

Patents

A patent provides an inventor the exclusive right to produce a good or service for a certain period subject to full disclosure of the invention. This establishes monopoly powers for the duration of the patent.

Payoff Interdependency

Is where the payoffs acruing to each action for players' involved in a game are dependant on the actions of the other players' in the game. for example a firm deciding to set its price must take into account the price reactions of all other related firms in the market until they can analyse the profit that will result from this price change. This is why game theory is so crucial to analysing how oligopoly markets work - as these markets have a high degree of interdependency.


Payoff(s)

Is a term used in game theory to illustrate players' preferences over the outcomes available to them in the game. Payoffs normally represent the utility to consumers or profit to businesses of playing a particular action in the game. Clearly players wish to maximise this payoff to meet their objectives of profit or utility maximisation.

Below is a payoff matix to illustrate the breakdown of supermarkets payoffs corresponding to pricing decisions in terms of the profit they will receive.


Pegged Exchange Rate

When an exchange rate is fixed relative to another currency.


Pension Fund

A fund established by an employer to facilitate and organise the investment of employees' retirement funds contributed by the employer and employees. The pension fund is a common asset pool meant to generate stable growth over the long-term, and provide pensions for employees when they reach the end of their working years and start retirement. 


Percentage change

Is a mathematical way of measuring the difference in values expressed in percentage form. These are predominantly used to emphasise significant changes in data in a clear form. 


Perfect competition

Is a market structure that describes the conditions required for intense competition to take place amongst firms in an market. This market structure is a contrast to a monopoly market. 

The assumptions that are required for perfect competition to hold are as follows:

  1. Large number of buyers and sellers in the market.
  2. No individual firm has significant market power to influence the market price - this outcome means that all firms are price takers and have to sell at the prevailing market price.
  3. All firms sell a homogeneous products - the products that firms are selling are identical in terms of their product characteristics. This creates a horizontal (perfectly elastic) demand curve as all products that firms produce and sell are perfect substitutes for each other.
  4. Freedom of firms to enter and exit a market - any firm can enter the market to enjoy profits as there are no barriers of entry present. However, firms can also freely leave the market costlessly if they are making a loss due to no barriers to exit being present. It is this assumption of freedom of entry and exit which means firms in this type of market structure will always make normal profits in the long-run.
  5. Perfect knowledge available to all firms - sellers have perfect knowledge regarding their competitors and possible technological improvements available to the market and consumers have perfect knowledge of all firms prices and therefore will never buy the good at a higher price than at the market price. This assumption reinforces the prevailing market price that all firms must 'take'.   
  6. Perfect mobility of factors of production - factors (e.g. labour and capital) can move from one production process to another to help complete different types of work. 

If firms operate in a market where all of these conditions are met it creates an environment of perfect competition. However, perfect competition is often discussed as being just a theoretical model of competition as a result of the unrealistic assumptions that are required to hold e.g. can a market ever have a situation of perfect knowledge across all firms and consumers?

Therefore, despite having a minimal role in terms of practical application, this model of competition is used as a comparison tool against other and more inefficient market structures such as a monopoly or oligopoly. This is because perfect competition leads to an efficient outcome in the long run in which social welfare is maximised, due to firms producing at the point that is allocatively and productively efficient. Therefore, the theory of perfect competition is a good evaluative tool in itself to use as a benchmark to assess the market outcomes from other types of market structure. 

A perfectly competitive firms demand curve is perfectly elastic (horizontal) at the prevailing market price, this means two things. First of all the firm can sell as a high quantity of the product they are producing as they want, without impacting the market price. But, the firm has to sell the quantity at the market price otherwise the demand for their product drops to zero. This is because consumers have perfect knowledge about other alternative sellers prices and will always buy the same product from the cheapest possible location. 

However, when graphically representing the perfect competition market structure for individual firms and the market in general it is important to consider the time horizon that firms are operating in. This is because the efficient outcome of perfect competition is only guaranteed in the long-run. In the short-run, firms produce at the profit maximisation point (P=MC), which can either be above, below or equal to the average cost of production. This means that firms can be making supernormal profit, normal profit or an economic loss in the short-run.

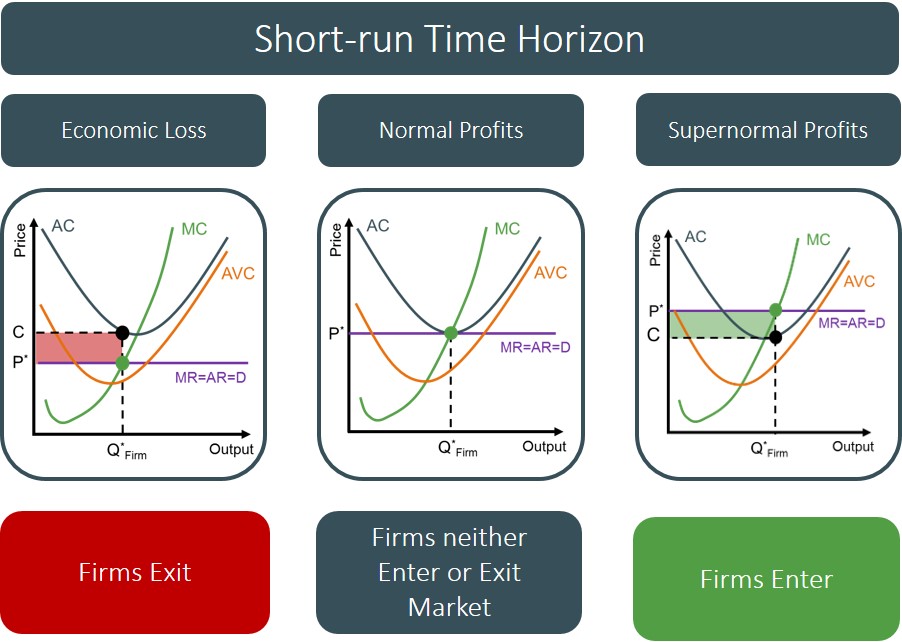
Whether a firm makes a profit or not in the short-run all depends on the type of market that the firm is operating in, the position of the firms average cost curve and the market price that prevails.

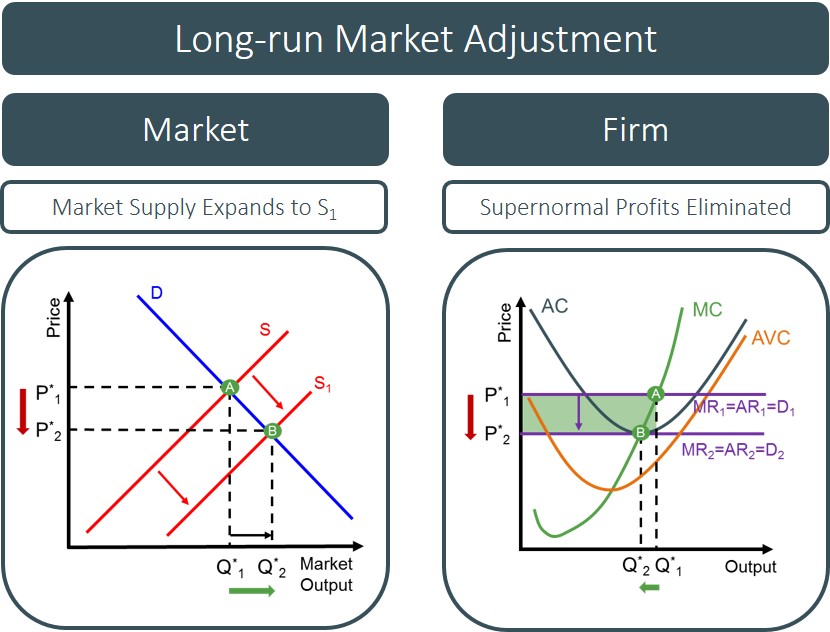
However, in the long-run all firms operating in a perfectly competitive market will make normal profits because of the fact that firms can freely enter and exit the market. For instance, if firms are making a profit in the short-run then this triggers firms that are not currently producing in the market to enter as the presence of supernormal profits lures and incentivises them to start producing. However, the decision for firms to enter increases the supply of goods produced in that market and without an accompanying equal change in demand, this creates excess supply in the market. The excess supply causes the price of the good to fall and as the price determines the position of the perfectly elastic demand curve firms face, this causes the profit maximisation point to fall closer to the average cost of production (which are assumed unchanged). This process of moving down a firms marginal revenue curve causes the amount of profits accruing to each firm to fall. Firms keep entering the market until eventually all supernormal profits have been eliminated and all firms are producing at the minimum of the average cost curve, signalling normal profits. This means all transactions will take place at the market equilibrium price and total output/consumption will be at the market equilibrium level. Below is an example of this market adjustment:

This process works in reverse if in the short-run firms were making an economic loss - firms are incentivised to leave to minimise their losses. In the case of normal profits being made in the short-run no change is made to the market.

This means the result of all firms in the long-run under perfect competition are shown below:

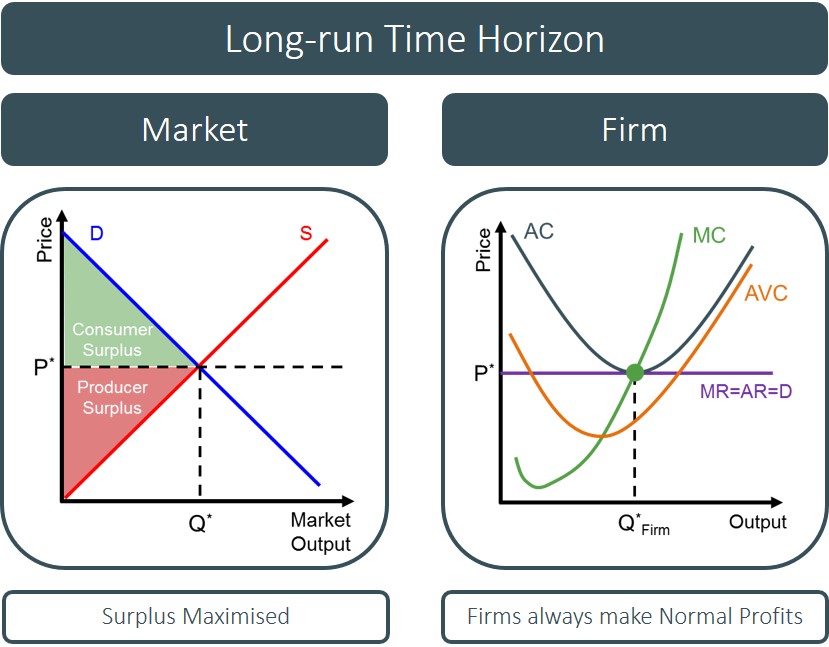
This outcome is the most efficient market equilibrium that can be achieved because of the fact that there is no deadweight loss triangle present unlike in other market structures e.g. a monopoly. 

It creates the most efficient outcome because firms that operate in a perfectly competitive market are classed as productively efficient in the long-run as they end up making normal profits and producing at the minimum of the average cost curve. 

Also most firms can be classed as allocatively efficient in the long-run as firms produce at the point where P=MC. However, this only holds if firms are producing in a market with no externalities present. This is because when there are externalities present, private costs and benefits do not equate to social costs and benefits. If the marginal social benefit and costs do not equate then this means that consumer and producer surplus cannot be maximised and this means there must be a better allocation of resources available in the market.

However, despite perfect competition providing efficient results, one type of efficiency that is not achieved is dynamic efficiency. This is because in order for firms to be incentivised to achieve dynamic efficiency they need to make supernormal profit to enable them to undertake the investment required for the research and development needed to innovate the production process. It is unlikely that this will be achieved in perfect competition because the assumption of perfect knowledge across all firms means that firms can just replicate any new products or new techniques developed in the production process, removing any competitive/cost advantage this type of investment is meant to develop. Also the fact that firms cannot make supernormal profit in the long run means that they will never be in a position to be able to protect the advantages of their investment and will not be encourage to make the changes required. The fact that dynamic efficiency is not achieved creates wider implications for the economy because it is investment that drives the long-run trend growth rate and therefore if investment is stunted because of this form of competition, long-run growth will be permanently revised at a lower level. 

The final point to mention regarding perfect competition is the theoretical model can be used as a yardstick to compare other market structures against. This is because in reality industries are never really perfectly competitive, but by relaxing some of the assumptions of perfect competition it may mirror some types of market structures (e.g. monopolistic competition) and therefore allow us to asses and evaluate those markets. For instance, the closer an industry is to perfect competition, the closer it is to the efficiency results which fosters improved services and products. 


Perfect information

When buyers and sellers have complete information concerning factors that could influence decisions to buy and how to produce a good i.e. prices and quantities for sale, how to make the goods and the most efficient production techniques.

Below is a graphic to highlight the main factors that have to hold for agents to have full and complete information about the market.


Perfect knowledge

When buyers and sellers have complete knowledge concerning factors that could influence decisions to buy and how to produce a good i.e. prices and quantities for sale, how to make the goods and the most efficient production techniques.

Perfectly elastic demand

Is a term used to relate to goods that have a price elasticity of demand value of infinity. This essentially means that the quantity demanded by consumers for these types of goods depends severely on the market price i.e. if the price increases or decreases this will cause demand to collapse to zero for this good. This is normally a result of their being a large number of perfect substitutes available in the market. 

We can represent a good that has a perfectly elastic demand curve as a demand curve that is horizontal at the market price. This is shown below:

Any amount of a good can be demanded at or below the price level contained in the demand curve while there will be no demand for the good at a higher price. As demand cannot be determined the price elasticity of demand is infinite. Price elasticity of demand is also infinite at the point where demand is zero.


Perfectly elastic supply

Refers to goods that have a price elasticity of supply value equal to infinity. This essentially means that any amount of a good will be supplied at the prevailing price, but nothing is supplied below this prevailing price. 

This is shown in the diagram below:

perfectly elastic supply diagram

So in this case if the price falls to P2 (even with a small price fall) the quantity supplied by the firm will instantly drop to zero. This is normally a theoretical application of PES to supply curves.


Perfectly Inelastic Demand

Is a term used to relate to a good that has a price elasticity of demand value of 0. This essentially means that the quantity demanded by consumers for this good does not depend on the price of the good i.e. consumers will demand the same quantity of the good at every possible price.

We can represent a perfectly inelastic demand curve via a vertical demand curve as shown below:

For this demand curve the PED values are equal to 0 at all points and therefore changes to prices have no effect on quantity demanded e.g. diabetic patients demand for insulin.

Perfectly inelastic demand also arises if the price of a good is zero and quantity demanded is at its maximum possible level. However, this is only of theoretical significance as even a 1p rise in price will mean that elasticity rises above this level.


Perfectly Inelastic Supply

This refers to when only one quantity of a good can be supplied at any given price. As a result this means the price elasticity of supply (PES) value is equal to 0.

The shape of a perfectly inelastic supply curve is shown below:

The supply curve is vertical at the specific quantity supplied of Qs. This curve highlights that any change in price does not cause a change in the quantity supplied. It is very rare for firms to face an inelastic supply curve as traditionally firms will always supply more when the price of the good they are supplying increases. An example of this might be the UK property market as demand has been outstripping demand, forcing house prices up. This is particularly the case in areas such as London where it is almost impossible to find new land to build properties. Which is an explanation over why house prices are so much expensive in this area. 


Permanent income

The amount of income a household could spend over its lifetime without reducing the value of its assets e.g. dividends on shares or interest on deposits.

Phillips Curve

The Phillips Curve is an economic model that illustrates a stable inverse relationship between the inflation rate and the unemployment rate. It is used to show policymakers that there is an exploitable trade-off between the unemployment rate and the inflation rate i.e. unemployment can be reduced at the expense of higher inflation.

The Phillips Curve was first established in 1958 by an economist named A. W. Phillips, in which 96 years worth of data was collected on wage inflation and unemployment. The data points were plotted on a graph, with the unemployment rate on the x axis and the wage inflation rate on the y axis. A line of best fit was then drawn through this collection of data points and this line of best fit was downward sloping, showing the inverse relationship between the two variables and this has now become known as the Phillips Curve.

Since then the Phillips Curve has been adapted to provide more theoretical importance for policymakers to consider when setting economic policies. As now the inflation rate (price inflation) is used instead of wage inflation. The result of the inverse relationship still holds but now concerns the inflation rate instead. 

Below is a diagram to illustrate the basic convex shape of the conventional Phillips curve discovered by A. W. Phillips. This curve illustrates the main policy trade-off facing governments i.e. a government cannot achieve both low unemployment and inflation. 


By using this curve the government can aim to reduce the unemployment rate by introducing an aggregate demand stimulus, which increases real output and unemployment in the process, but at the same time this creates inflationary pressures (demand pull inflation) as a result of a positive output gap emerging. This positive AD shift can be represented by a movement up the Phillips curve to signify an increasing inflation rate when the unemployment rate decreases.


However, in the 1970's the smooth, stable inverse relationship seen in the Phillips curve between the inflation rate and the unemployment rate began to break down as suddenly data points were being recorded where both the unemployment and inflation rate were high and this contradicted the main result of the original Phillips curve. 

As a result of this, it was commonly accepted that in the long-run the Phillips curve would take a different form and the trade-off between inflation and unemployment would disappear. The long run Phillips curve is vertical at the natural rate of unemployment and depicts no exploitable trade-off between the inflation rate and the unemployment rate. The key difference for policymakers when dealing with the LRPC is that demand side policies designed to reduce the unemployment rate below the natural rate do not prove effective as workers re-adjust their wage aspirations in light of higher inflation, which means unemployment  always remains at the same level in the long-run but with higher inflationary pressures. So effectively the long run Phillips curve is established by multiple shifts of the short run Phillips curve

The distinction between the shape of the short run and long run Phillips curve is shown below.


Therefore, in the long-run the only way to reduce the natural rate of unemployment is to introduce specific supply side policies which aim to improve the productive capacity of the economy by creating sustainable unemployment reductions, which create an LRAS shift (outwards) in the process. Persistent demand side policies will create an inflationary outcome for the economy. However, these policies must be specifically targeted to improve worker flexibility otherwise will not create the curve movements required to reduce unemployment below the natural rate.

The Phillips curve is a contentious issue as it all depends on your political persuasion, in terms of how the curve is interpreted. But, the main evaluation points regarding the Phillips curve are:

  • Recent evidence from the UK economy appears to contradict the main theoretical result of the Phillips Curve i.e. data points reflecting high unemployment and inflation rate.
  • The current version of the Phillips Curve is an adapted version of the original i.e. shows price inflation instead of wage inflation.
  • The Phillips Curve may be subject to measurement errors/biases because data quality and changing nature of data will affect the outcome depicted by the Phillips curve.
  • The distinction between the short run and long run Phillips Curve i.e the trade-off is not present in the long-run.
  • To take into account the type of expectations that economic agents have i.e. if economic agents have rational expectations it might mean there is no short-run and long-run distinction between the Phillips Curve. 

Planned supply

The level of output that firms plan to supply. This can be problematic as decisions have to be taken before actual demand conditions are known. This is particularly problematic in agriculture when supply decisions have to be made many months in advance.

Policy compromise

When a government policy is weakened to allow achievement of another objective e.g. when greater cuts are experienced across other government departments to preserve expenditure in priority areas.

Policy conflict

When a policy works against the achievement of another objective e.g. building additional transportation links is unlikely to contribute to the achievement of environmental objectives.

Policy indicator

A measure selected by government to determine the achievement of policy objectives e.g. any reduction in the percentage of students achieving C grade or better in A2 examinations is an indicator of the impact of education cuts.

Policy instrument

An initiative implemented to help achieve a policy objective e.g. regulations to prevent smoking in public places.

Policy objective

This is the purpose or what the policy is attempting to achieve e.g. the austerity policy was attempting to protect the economy in the long term by avoiding increased borrowing costs for government, firms and individuals.

Pollution permits

Issued by the government to authorise producers to produce a specified amount of pollution. Provided the system can be policed effectively it can correct market failure by limiting pollution and the output associated with it.

It is important for the government to control pollution as pollution is an example of a negative production externality which gets released onto society and as a result exposes society to a large social cost. Pollution is produced as a result of manufacturers failing to recognise the wider cost to society of this pollution being created during the production of goods and services. Therefore to protect social welfare and to remove the dead weight loss triangle associated with these goods, governments are committed to meeting pollution reduction targets. They hope that by placing these pollution targets on society it will incentivise private businesses to adapt their production process, in order to reduce pollution levels.

Pollution permits are issued and released into the market via the government and the key characteristic surrounding these permits, is that the fact that they are tradable  i.e. pollution permits can be bought and sold between firms. The permits themselves grant an individual firm the legal right to produce a fixed level of pollution. The permits are enforced via financial punishments to ensure that firms stick to the pollution permit limits. But crucially, any firm that produces below their emissions limit can then sell the rest of the permitted emission allocation to other firms who have exceeded their pollution limit. This works because their are some firms that make use of materials throughout the production process that produce vast amounts of pollution and to keep the business going they must continue to pollute.  This effectively means the firms that pollute the most, must acquire the greatest amount of pollution permits. Therefore, it is these firms that have to face the greatest burden of the permits, as they increase the firms costs, reducing their profitability and making them less competitive.

The desired outcome of the policy is that after a period of time firms will have transformed their production process into a more emission friendly process (via green technology) so that they can reduce the amount of pollution permits they are required to buy and hold. Eventually, if all firms can successfully implement a more environmentally friendly approach to their production process, then the government can gradually decrease the number of permits circulating in the market.

In 1997, an agreement called the Kyoto Treaty was signed to enforce tradable pollution permits across countries. In this instance, each country was awarded a pollution permit to limit their carbon dioxide emissions. The countries which were able to reduce their emissions cheaply were incentivised to do so. This meant they could sell the rest of their quota off to countries which required more pollution permits.

It is also important to consider the limits of the pollution permits effectiveness in reducing the overall level of pollution. These will be good evaluation points to make in an exam.

Firstly, it is very difficult for the government to identify the optimal quantity of permits to issue in the market and the most appropriate way to distribute them in the first place. Introducing too many permits into the market will lead to pollution levels staying at the same level. Not issuing enough permits will have the opposite effect and firms will become unnecessarily constrained and this can reduce the activity, efficiency and productivity of these firms.

Also, as pollution is a negative externality it makes it very difficult to measure and quantify and therefore this makes it difficult for the government to set the right pollution limit per permit. 

Pollution permits are also criticised because they do not actually address the issue of pollution and instead create a system in which the least polluting firms receive the smallest amount of permits, whilst the most polluting firms receive a large percentage of the permits. Therefore, they can fail to make a substantial impact on the pollution levels of firms and a country. Alternative policies such as indirect taxation may prove more effective in curbing pollution levels in a country as this allows the externality to be internalised. These alternative policies might also be easier to implement, as it does not require significant monitoring like in the case of permits. The administration costs may well be lower as well.  


Portfolio Investment

An investment to acquire shares of a company that does not establish any control over the management of a company. For the purpose of national trade accounts investments must not acquire more than 10% of a company to be categorised as portfolio investment.

Portfolios

The financial assets owned by individuals or firms.

Positive consumption externalities

Benefits arising from the consumption of a good or service that are experienced by third parties e.g. the benefits of education apply to society as much as to the recipient.

These goods are often under-provided and are called a merit good. This is because there is a divergence between the marginal private benefit and the marginal social benefit which causes individual producers to under provide the good, as the producers do not take into account the long-run benefits that this good creates for society. As a result this creates a dead weight loss triangle and market failure. 


Positive expectations

When the future outlook for economic variables is positive e.g. interest rates will fall and the economy will grow at a faster rate.

Positive externalities

Are positive costs and benefits arising from the process of production and consumption that are incurred or experienced by third parties.

Positive externality

Are positive costs and benefits arising from the process of production and consumption that are incurred or experienced by third parties.

Positive output gap

When actual GDP is greater than the value of GDP if it had grown consistently in line with the trend rate of GDP growth. Normally characterised by rising real output and inflation.


Positive production externalities

Benefits arising from the production of a good or service that are experienced by third parties e.g. the benefits of innovation spillover especially after the expiry of patents.

Below is a diagram to show a positive production externality that is being imposed on third parties. This caused because of the divergence between the marginal private cost and marginal social cost. Because individual producers do not realise the positive externality they are releasing onto society they produce a level of output below the socially optimal level, creating a dead weight loss triangle and market failure.


Positive statement

Is a statement on an economic issue that is supported by factual evidence.

Potential Competition

This is the level of competition that could develop in a contestable market if firms decide to engage in hit-and-run entry.


Poverty or earnings trap

When individuals in work do not perceive any benefit in a wage rise as the increase in taxes and loss of welfare benefits this triggers may mean that they are no better off.

PPF

A convex curve that joins all possible combinations of output when all resources are fully engaged in production.

The diagram below shows the basic shape of a country's PPF, illustrating the the distribution and allocation of resources towards producing goods to help the economy achieve the full employment level of output. Any point on the PPF is a point that is pareto optimal, productively and allocatively efficient due to the utilisation of all the factors of prodcution in the economy.


Predatory Pricing

Is when a firm decides to set a price below the marginal cost curve for a short period of time to induce the exit of a financially inferior rival out of the market. The incumbent firm engaging in this behaviour makes a short-term loss but as long as this can be recouperated with higher supernormal profits immediately after the rival's exit the firm will be willing to engage in this strategy.

Below is a graphic to show the logical chain of reasoning behind the process of a predator pricing strategy by an incumbent firm.


Premises

The physical location used by a productive process e.g. office, factory or shop.

Premiuim to par

Is a term to describe a bond that is being sold and traded above its par value and hence at a premium. This can happen for a variety of reasons but the most common reason is when interest rates being to fall. A bond will then trade at a premium as it will offer a higher coupon rate compared to the interest earned on similar risk-related assets i.e. the excess demand for bonds will force the bond to trade at a premium, but investors will be happy to purchase this as they want a bond that offers them a higher yield over similar risk assets.


Preventive Regulation

Aims to curb excessive risk-taking, and has tended to focus on capital adequacy requirements with assets such as BASLE and ensure that banks are kept on a going concern basis.


Price

The financial value that consumers place on the utility they derive from consuming a good or service.


Price Bubble

When prices rise rapidly over a period of time (weeks or months) and then drop within a very short period (days). These cycles are often initiated by a supply side shock and perpetuated by subsequent speculation encouraged by the opportunity to profit from rising prices.

Price control

These are imposed by governments to control prices in specific markets. The control will be structured to reduce price fluctuations or prevent very high/low prices.

Price controls

These are imposed by Governments to control the price in specific markets. The control will be structured to reduce price fluctuations or prevent very high/low prices.

These restrictions governing the price a market can sell a product for, is done in order to improve on the outcome achieved by the free market.

The two forms of price controls are:

  • Maximum Price
  • Minimum Price

The important point to understand when evaluating the effectiveness of price controls is the position of the price relative to the equilibrium price. For a maximum price to be binding, the max. price needs to be set below the market equilibrium price to force pressure on firms for the existing price to fall. Likewise, for a minimum price to be binding, the min. price needs to be set above the market equilibrium price to force pressure for the existing price to rise. Below is a set of diagrams to show this:

Because these price controls are distorting the market equilibrium that would prevail under the free market, it does introduce welfare implication for society. Under a max. price, producer surplus decreases (as firms are selling less goods at a lower price) and consumer surplus has a net increase (as the fall in consumption is overridden by the benefit of falling prices). However, there is a dead weight loss triangle that is created from this price because of that fact there is a loss of potential beneficial exchanges which could of been made at the market equilibrium i.e. producers were willing to sell at a higher price and consumers willing to purchase at a higher price. Therefore, social welfare is likely to be reduced. 

Likewise, for a min. price, producer surplus has a net increase (as firms are selling goods at a higher price despite the fall in consumption) and consumer surplus has a decreases (as consumption falls as well as prices rising). However, there is a dead weight loss triangle that is created from this price because of that fact there is a loss of potential beneficial exchanges which could of been made at the market equilibrium i.e. producers were willing to sell at a lower price and consumers willing to purchase at a lower price. Therefore, social welfare is likely to be reduced.

The welfare implications of the price controls is shown below in a demand and supply framework.

 Therefore it is the presence of the disequilibrium in the market which creates the dead weight loss triangle.

In terms of policy solutions, the government could introduce a subsidy in order to maintain the maximum price. This will outwardly shift the supply curve and remove the dead weight loss triangle and increase social welfare. However, this is expensive from the government's perspective as the subsidy may need to be financed by higher taxes or diverted expenditure from other areas of the economy. This also involves an opportunity cost, as alternative projects have had to be sacrificed as a result.

To eliminate the excess supply in the presence of a minimum price, the government could buy up the surplus of stock that firms have, in order to prevent them from dumping them on the market for a lower price. By doing so would shift the demand curve outwards and remove the dead weight loss triangle. This policy is similar to what is seen in a buffer stock scheme in agricultural markets. The main issue with this policy is that the government will be left with a surplus of stock of the good, this is problematic because storing inventories of a good can be very expensive from the government's perspective, but at the same time destroying this stock of goods is seen as a waste of resources. 

Below is set of diagrams to show the desired outcome of these policies (move to point c):


Price deflation

The rate of inflation is less than 0%.

Price Discrimination

The action of selling the same product to different groups of people (or in different circumstances) for different prices. This is done so that firms can convert as much consumer surplus into revenue and profits. 

There are three different forms of price discrimination that firms can choose from:

  1. First Degree Price Discrimination - charging consumers the maximum price they are willing to pay for 
  2. Second Degree Price Discrimination - charging consumers different prices based on the quantities consumed
  3. Third Degree Price Discrimination - charging consumers different prices based on the type of market segment they are in

However, producers only have the ability to set these forms of price discrimination if certain conditions in the market hold:

  1. The firms involved must be price makers to ensure that they can set the appropriate price that fits into their pricing strategies. Therefore, price discrimination is a strategy that can only be used if the market is imperfectly competitive. The more market power an individual firm has, the more successful price discrimination is likely to be for the firm. In a perfectly competitive market, price discrimination cannot take place because all firms have to take the current prevailing price as given. 
  2. The firm involved must be able to segregate the market into different types of consumers. Price discrimination is unsuccessful in markets that cannot be segregated because it allows the resale of the product from one consumer to another. This means that consumers who can purchase the product at a low price and then go on to sell their product onto a consumer that was facing a higher price. This is not the case for train tickets as children are charged a lower price than adults and cannot sell this ticket onto adults because of the fact that the markets has been divided into two sub-markets. Firms can segregate the market by dividing consumers up into different types based on: the time of consumption, gender, age, income status, location and consumption preferences.
  3. The consumers that are sold a product must have different price elasticities of demand, so that the firm can charge the consumers that are willing to pay a higher price a higher price, but for consumers who are not willing to pay a high price will be charged a lower price, so that encourages more consumers to consume. Therefore the elasticity of demand for consumers signals to firms how reluctant certain consumers are for paying a high price i.e. inelastic demand signals to the firm a high price and elastic demand signals to firms a low price.

The most common example of price discrimination is third degree price discrimination in which firms identify different types of consumers and a separate price is charged to each of the type of consumers e.g. train, cinema and theme park tickets.

Price discrimination diagrams can often be quite complicated to draw so the best way to draw these types of diagrams to remember a step by step procedure in which a new element on the diagrams is placed on at each step to make sure all elements of the price discrimination diagrams have been drawn. Below we are going to show the step by step process that needs to be taken  to highlight the impact of third degree price discrimination on the different sub-markets as well as the firm. For this particular case we are assuming that the firm involved is a monopolist and the conditions that are required for price discrimination are satisfied and the monopolist has segregated the market into two sub-markets - A and B. 

For the step by step process, the new elements added in at each stage will be highlighted in red and the stage achieved at the previous stage will be highlighted in black. 

This step involves setting up the diagrams. As this is a micro diagram for a a specific diagram the x axis represents quantity and the y axis represents price.

This step concerns drawing the two separate demand curves for market segment A and B. The monopolist splits the market into two sub-markets based on the fact that the consumers in the two sub-markets have a different elasticity of demand. Sub-market A faces an inelastic demand curve and sub-market B faces and elastic demand curve.

At any price above P, there are no sales to market B, so therefore at P and above the monopolist demand curve follows the same shape as the demand curve for market A.

At prices below P, sales are made to both sub-markets (B represents the demand corresponding to Market A and C represents the demand corresponding to Market B). Therefore, the part of the demand curve for the monopolist below the price of P is formed by adding horizontally the two sub-market demand curves together below this price.

The Marginal Revenue curve is always twice as steep as the Average Revenue curve.

The MR curve for the monopolist is formed by combing the marginal revenue curves from both sub-markets, using the same logic of how the AR curves were formed. The MR curve for the monopolist is twice as steep as the relevant sections of the AR curve.


Marginal Cost curve for the monopolist takes the usual tick-shaped form.

Monopolist profit maximises at the usual profit-maximising condition of MR=MC, but as a result of the market power it holds it can set a price up to the AR curve.

As the monopolist applies price discrimination to the two sub-markets the price of P is not set across the sub-markets. Instead they maximise profits by selling a higher quantity to market B and sell less to market A. To profit maximise across markets the condition that needs to be satisfied is that the MRA=MRB=MR across all markets. To achieve this the sub-markets needs to be charged different prices. Market A which has an inelastic demand curve, a higher price is charged because consumers are willing to buy the product at a higher price. However, market B has an elastic demand curve so a lower price to maximise the amount of revenue the monopolist can exploit from these reluctant consumers.

To identify the profits made by the monopolist via price discrimination the average cost curve needs to be drawn on for the monopolist.

Supernormal profits represent difference between sales revenue and costs of production. This method of price discrimination brings the monopolist larger profits at the expense of consumer surplus. 

Through the fact that the market becomes segmented, the pricing strategy increases total revenue when compared under a fixed pricing strategy and this increases the level of profit accruing to the monopolist as a result of an increase in sales. Also because of that fact that the firm has increased their scale of production it means it is likely to see a reduction in the firms costs as a result of a movement down the average cost curve, which can further increase profits in the long-run. However, whether the increased profits lead to better quality products and lower prices for consumers depends on the type of firm involved and whether they have the incentive to invest in R&D projects which can feed through to dynamic efficiency benefits. This may all depend on the type of industry at hand.

An evaluation point that could be mentioned when talking about price discrimination is the impact on consumers. This is because there are two types of consumers in the market and some will experience higher prices whilst others will experience lower prices and therefore the overall impact seen on consumers will all depend on the experience that consumers have in the market.


Price disinflation

When the rate of inflation reduces e.g. CPI grew by 2.2% in the year to October 2013 but reduced to 2.1% in the year to November 2013.

Price elasticity of demand

The proportionate change of the quantity demanded of a good in response to a proportionate change in price.

A good is classified as inelastic if it has a PED value that it less than 1.

A good is classified as elastic if it has a PED value that is greater than 1.

A good is classified as unit elastic if it has a PED value that is equal to 1.

The value of the PED for a good determines the type (slope and position) of demand curve in the market.


Price elasticity of supply

The proportionate change of the quantity supplied of a good in response to a proportionate change in price.

A good is classified as inelastic if it has a PES value that it less than 1.

A good is classified as elastic if it has a PES value that is greater than 1.

A good is classified as unit elastic if it has a PES value that is equal to 1.

The value of the PES for a good determines the type (slope and position) of supply curve in the market.


Price inflation

When the prices of goods and services rise over a period of time. The rate of inflation is positive.

Price level

The average price of goods and services in an economy. This is normally determined by measuring the price changes relating to a representative sample of goods and services

Price Maker

A firm that has a very strong market position and is able to dictate the price that consumers pay for its goods and services. This is normally associated with a firm that possesses monopoly power.

Below is a diagram to show how monopolistic firms can restrict output and charge whatever price they wish to do so to maximise profits. This is not the case in perfectly competitive markets where all firms have to take the market price as given and are price takers as they are all competing over a homogeneous good.


Price mechanism

How the interaction of demand and supply determine the price and quantities of the goods that get produced.

This price mechanism has three individual functions that it performs:

  • The first is the rationing function which enables prices to change in order to curb or encourage demand in order to cope with limited or excess supply. This often happens for the demand for sporting event tickets.
  • Then there is the signalling function which means that prices are there to inform economic agents about market fluctuations i.e. if the price of a good is high this signals to producers that this good is in high demand and therefore they should produce more.
  • Finally, prices have an incentive function which provides agents with the incentives to change their behaviour i.e. firms are incentivised to produce more goods if the price is high due to higher margins and profit incentives.

Below is a brief summary of these functions of the price mechanism.


Price Taker

When firms in a market do not have sufficient market power to be able to influence the market price and as a result charge the optimal price in order to maximise profits. All firms in a perfectly competitive market are classified as price takers due to size of the market and close substitutes available to each firm's product.

Below is a diagram to illustrate price takers in a perfectly competitive market. These firms have to accept the market price as given due to the fact that they are in a market with hundreds of firms all producing a homogeneous product and therefore no firm has sufficient market power or control to set their own prices.


Price War

Occur where firms compete with each other to charge lower prices and thereby force the market price down. This has occured most recently in the UK Supermarket Industry with discount stores such as Aldi and Lidl relentlessly slashing prices of popular products below that of the Big 4 supermarkets.

Below is the logical chain of reasoning to emphasise the main features of a price war.


Primary Products

Raw materials that are either extracted or farmed from land and the sea.

Principal

The individual that authorises an agent to act on their behalf in personal and business transactions.


Principal agent problem

Scenarios in which economic outcomes are distorted because economic agents (principal) rely on the services of and are influenced by an agent that may have different objectives/incentives.

The most common example of this is the differing objectives between shareholders and managers. Shareholders wish to maximise profits and managers have internal goals relating to self-interest, but due to asymmetrical information it is difficult for shareholders to detect this.

Below is a breakdown of this type of problem relating to shareholders and managers. In this case the manager has three main objectives to achieve alongside maximising return for shareholders. For instance it may be that managers try to help the firm acquire as much market share as possible in order to make the firm grow and expand to meet those customers. This is becaue firms that have exponentially grown are often the firms that are most impressive from a manager's performance persepctive and therefore it will put the manager's value higher from not just within the company but from external companies. Therefore they may decide to reinvest majority of the profits the company makes to help fuel expansion rather than paying higher dividends to shareholders.


Prisoners' Dilemma

A situation analysed using game theory that shows why two rational individuals might not cooperate, despite it being in their best interests to do so.The Nash Equilibrium in this game will always be for both players to betray each other despite the payoffs for both players being higher if they were willing to cooperate. This game is based on the idea of two prisoners who have committed a crime with an adverse feeling towards years in prison.

Below is a payoff matrix to illustrate the equilibrium concept of the game.


Private costs and benefits

The costs or benefits experienced by buyers and sellers that are reflected in the market equilibrium position.

Private Debt

Private sector debt is the stock of liabilities held by the sectors non-financial corporations. This is comprised of personal loans, personal mortgages, business debts, and debts of the financial sector.


Private Equity Company

Is an investment company that makes investments in the equity of companies with funding raised by retail and institutional investors.


Private good

A good that is scarce because it is excludable (it is possible to exclude non-consumers from the benefit of a good or service) and rivalrous (the consumption of a good by one consumer diminishes the amount of the good available to other consumers).

Private goods

A good that is scarce because it is excludable (it is possible to exclude non-consumers from the benefit of a good or service) and rivalrous (the consumption of a good by one consumer diminishes the amount of the good available to other consumers).

Privately optimal output

The equilibrium level of output if external costs/benefits experienced by third parties are not reflected in the market equilibrium.

Privatisation

The process by which a state owned enterprise would be sold to private and institutional investors e.g. Royal Mail.

Producer Sovereignty

The production of goods and services is influenced by the preferences of producers.


Producer surplus

The benefit achieved by suppliers because the equilibrium price is higher than the price suppliers would be prepared to supply the goods at. This is always represented by the area above the supply curve and below the market price.


Producer tax burden

The amount by which the imposition of an indirect tax will reduce producer surplus. The tax burden imposed on producers will depend crucially on the elasticity of the demand curve facing the market. As the less price sensitive consumers are the more of the tax that can be passed onto them in the form of higher prices as it will increase their level of profit despite price rises due to a lack of drop-off in demand.

Below is a diagram to illustrate how the imposition of an indirect tax implaces a burden on producers. In this instance the demand curve is neither inelastic or elastic and therefore the tax burden is split evenly between the consumers and producers.

Below is a diagram to illustrate when the demand curve is inelastic and therefore the tax burden is split unevenly towards consumers ahead of producers.

Below is a diagram to illustrate when the demand curve is elastic and therefore the tax burden on producers is small.


Product differentiation

The process by which the features of products are varied and promoted to differentiate a product from other similar products.

Production

The process that converts factors of production into goods and services.


Production externality

Externalities that arise from the production of a good.

Production possibility diagram

A diagram that plots all the possible combinations of goods and services that an economy could produce.

The diagram below shows the basic shape of a country's PPF, illustrating the the distribution and allocation of resources towards producing goods to help the economy achieve the full employment level of output. Any point on the PPF is a point that is pareto optimal, productively and allocatively efficient due to the utilisation of all the factors of prodcution in the economy.


Production possibility frontier

A convex curve that graphically represents the production points for an economy where all resources are fully engaged in the production of an economy's goods and services.

The PPF is the diagram that is best used to highlight the economic problem because if an economy moves from one point on the PPF to another it involves an opportunity cost as finite and scarce resources have to be diverted from one industry to another. This increases the production of one good but decreases the production of the other. The decrease in production represents the opportunity cost and this is quantified by the gradient of the PPF at any one point.

The diagram below shows the basic shape of a country's PPF, illustrating the distribution and allocation of resources towards producing goods to help the economy achieve the full employment level of output. Any point on the PPF is a point that is Pareto optimal, productively and allocatively efficient due to the utilisation of all the factors of prodcution in the economy (Point B, C, and D). However, if the economy is producing at a point inside the PPF (Point A) this represents a feasible production point, but one that is productively inefficient. This is because at this point an economy can increase the production of one good without a resultant fall in the production of another good, due to the fact that there are unemployed resources at this production point.

An economy can produce at any point on or inside the PPF. However, if the economy tries to produce at a point beyond its existing PPF (Point E), this is an infeasible production point assuming ceteris paribus. This is because even if an economy utilises all of the economic resources available any point beyond the PPF is unattainable unless an economy experiences an increase in the quality and/or quantity of factors of production available. 


Productive Efficiency

When output occurs at a point where average costs are lowest (the lowest point on the average cost curve) and all resources are fully utilised in production (actual production will position output at a point on the PPF).

Below is a diagram to show how individual firms and an economy achieve productive efficiency. For individual firms, they are charging a price at the lowest point of the average cost curve which means they are producing goods at their most productive point. For the economy to be productively efficient all firms have to be using all factors of production in the most efficient way and hence lie on the frontier of the PPF.

Productive efficiency graph


Productive inefficiency

When output occurs at a cost higher than minimum average cost (any point other than the lowest point on the average cost curve) and at a point where some resources are not utilised (and point within and not on the PPF)

Below are a set of diagrams to illustrate when individual firms and the economy are producing at a productively inefficient point and therefore costs are not being minimised.


Productive potential

The amount of goods and services that an economy is capable of producing.

Productivity

A measure of production representing the output produced by each input. It is usually measured by units of input.

Below is a graphic to assess that out of the following firms, Firm B is more productive than Firm A because it uses the same number of inputs but produces 10 times more units of output.


Profit

The reward for Enterprise. It is the difference between sales revenue and costs. There are many different definitions and it is important to understand the difference between normal profit and abnormal profit.

Progressive tax

Are usually direct taxes on assessable income and wealth. The tax will be structured so that a higher proportion of the assessable item is paid in tax as the assessable amount rises e.g. income tax.

Progressive taxes

Are usually direct taxes on assessable income and wealth. The tax will be structured so that a higher proportion of the assessable item is paid in tax as the assessable amount rises e.g. income tax.

Propensity to consume

How much of their income consumers are prepared to spend.

Propensity to save

How much of their income consumers are prepared to save.

Property deeds

A legal document confirming ownership and the terms of ownership of a property.

Property rights

When consumers buy a good or service they usually acquire property rights which means that they have exclusive rights to use or benefit from consumption of the good. However, there are situations where external benefits may dilute these property rights.

Proportionate change

When a change in one variable is accompanied by a change in another variable and this proportionate change remains the same regardless of the values. 


Proportionate tax

A simpler alternative to direct and progressive taxes which apply the same single rate of tax on all the income and wealth of all taxpayers.

Protective Regulation

Is a type of regulation that focuses on ensuring that economic agents such as depositors and taxpayers are protected from unnecessary risk taking in the financial sector. This type of regulation often takes the form of lender of the last resort facilities and deposit protection (which can in turn lead to more moral hazard problems though).


Prudential Regulation Authority (PRA)

Resposnsible for the supervision of individual financial institutions, to ensure the individual risks are managed appropriately. Ensuring failure does not lead to contagion effects elsewhere in the financial sector. Therefore they mainly specialise in macro prudential regulation.

Below is an illustration of the UK regulatory structure of the financial sector.


Public Debt

Is the debt that is owned by the government of a country. A high level of public sector debt can be argued to be positive and negtaive for the economy depending on the person's inclined way of thinking. It can increase economic growh by fostering more investment in infrastructure or it can decreae economic growth via crowding-out effects.

Below is a graphic to show that if the government runs up a significant budget deficit then it accumlates the level of public national debt for a country. This is why government's are under pressure to not consistently run a budget deficit, so that the burden of debt can be be shaved off. As the more indebted a country becomes the lower their creditworthiness is i.e. credit rating deterioriates.


Public expenditure

The expenditure undertaken by the government to provide things like welfare benefits, public services and infrastructure.

Below is a breakdown of the main sectors that public expenditure has been allocated to by the government in 2014/15. With current spending attracting the biggest percentage of this expenditure as this represents the ongoing costs of maintaining government services.


Public goods

A good that is non-excludable (it is not possible to exclude non-consumers from the benefit of a good or service i.e free rider problem) and non-rival (the consumption of a good by one consumer does not diminish the supply available to other consumers) e.g. armed forces, police, street lighting, flood defences


Public Sector Net Borrowing Requirement (PSNBR)

This is the difference between government spending plans and the amount of taxation revenue it raises. As it includes any proceeds from the sale of government assets it represents the amount of money a government needs to borrow to make sure all expenditure is funded.


Public Sector Net Cash Requirement (PSNCR)

This is the difference between government spending plans and the amount of taxation revenue it raises excluding any proceeds from the sale of government assets

Purchasing power parity

A concept that helps to compare the difference in the cost of the same good or service in different countries by using exchange rates to convert the price of the good into a single currency. Parity exists if there is no differential.

Pure monopoly

A market that is un-competitive as it consists of just a single firm. Very few remaining examples in the UK due to the break up and privatisation of the post war state monopolies.

Pure public goods

A good that is non-excludable (it is not possible to exclude non-consumers from the benefit of a good or service i.e free rider problem) and non-rival (the consumption of a good by one consumer does not diminish the supply available to other consumers) e.g. armed forces, police, street lighting, flood defences


Display # 
Forgot your password?