The EzyEducation website uses cookies to help ensure we give you the best experience.
If you continue without changing your settings, we assume that you are happy to receive all cookies on the EzyEducation website.
Please refer to our Privacy and Cookies Statement to

find out more.

Continue

Economic Terms

All   0-9   A B C D E F G H I J K L M N O P Q R S T U V W X Y Z

Secured Loan

A loan in which the borrower pledges some asset (e.g. a car or property) against the value of the loan, which then becomes a secured debt owed to the creditor. This is done in mortgage loans and car loans to ensure that borrowers have the correct incentives to repay the loan in full with interest.


Service

Is an intangible commodity e.g. banks offer lending services to borrowers.


Services

Is an intangible commodity e.g. banks offer lending services to borrowers.


Shadow Banking Sector

Financial intermediaries involved in the creation of credit, but are not subject to regulatory oversight e.g hedge funds. This sector is exponentially growing and in 2013 grew by $5 trillion to $75 trillion, making up on average 25% of all financial assets, roughly half of the banking system assets, and 120% of GDP. This is a worrying trend as lower capital regulation imposed on these types of FIs raises fears of more bank failures and systemic crises.


Share

Is a form of equity in which investors who purchase these shares receive a percentage of the ownership of the company, as well the guaranteed percentage of future profits the company earns. Unlike with bonds this investment from investors never has to repaid back directly at a fixed point in time, but the company has to sacrifice some of its ownership to raise finance through this channel compared to issuing debt.

Below illustrates the basic transaction of an investor buying shares in a bank. This is one of the main ways that a bank can raise finance for their asset creation like loans. However the more equity a company issues the less control over the operations of the business they have.


Shifts in demand

The position of the demand curve moves due to a change in one of the determinants of demand. Shifts can be positive (to the right) or negative (to the left). If demand shifts there is an equal change in demand at every price level.

Below is a diagram to show the two types of shift that can occur for the demand curve - an outward and inward shift. These shifts can occur because of a variety of different reasons i.e. a change in disposable income will either increase or decrease the amount consumers wish to buy at a specific price.

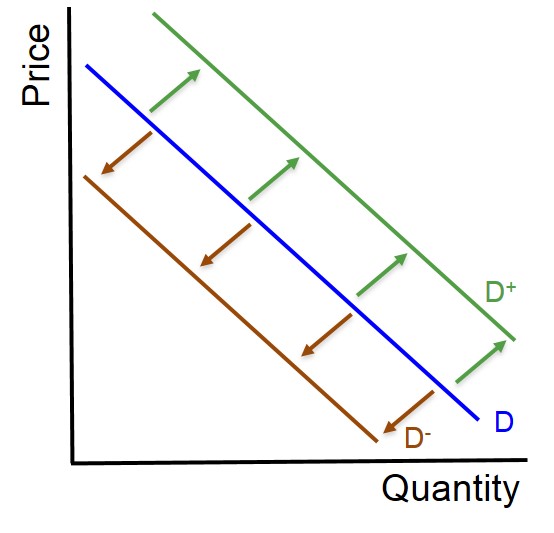
However, when evaluating a demand curve shift it is important to understand how significance the shift is. This is because some shifts may be small and therefore this will not have a significant impact on the price or quantity in the market. Whilst other demand curve shifts will be large and bring about large changes in the price or quantity in the market.

One of the most influential factors relating to how significantly a demand curve shift impacts the market equilibrium is elasticity. If the demand curve is  inelastic, then the demand curve shift will have a reduced impact on the quantity demanded, despite large price changes. However, if the demand curve is more elastic, then the demand curve shift will have a significant impact on quantity demanded, without large changes in prices. 


Shifts in supply

The position of the supply curve moves due to a change in one of the determinants of supply. Shifts can be positive (to the right) or negative (to the left). If supply shifts there is an equal change in supply at every price level.

Below is a diagram to show the two types of shift that can occur - an inwards and outwards shift. These shifts can be caused because of a variety of reasons. For instance if the cost of a raw material changes then this is likely to change a firm's supply decision as the more expensive a good is to produce, the fewer they will supply (inward shift). On the other hand, if a good is less expensive to produce, the more of the product they will supply (outward shift).

However, when evaluating a supply curve shift it is important to take into account the significance of the shift. This is because large supply curve shifts will have a larger impact on the market equilibrium compared to smaller supply curve shifts. The significance of the supply curve shift will also depend on the elasticity of the curves. As inelastic supply curves will have a greater influence on the price compared to the quantity. Whilst, elastic supply curves will have a greater impact on the quantity rather than the price. Therefore, these are evaluative points that should be considered when analysing a supply curve shift. 


Short run aggregate supply curve

Illustrates the positive relationship between real output and the price level.

Below is an illustration of the SRAS curve. It is upward sloping because if real output increases, more goods need to be produced but this can only occur if the price level rises. This is because production costs rise when output rises. So for more goods to be supplied this will require the price level in the economy to rise, as the higher production costs are passed onto the consumer in the form of higher prices.


Short-run

When at least one factor of production is fixed. For most businesses this consists of only being to vary labour in the short-run but not fixed inputs such as capital and land - where long-term contracts need to be drawn up.


Short-Run Phillips Curve

This is a curve that shows that there is an exploitable trade-off for the government when wishing to achieve employment or inflationary objectives. Therefore, the curve shows that changes in the level of unemployment have a stable statistical effect on the level of inflation in an economy.

It works this way because if there is a positive AD shift there will be a subsequent increase in demand for labour as growth puts pressures on firms to meet higher output demands. This causes the pool of valued and skilled labour to fall and therefore firms must compete over these scarce workers and this puts pressure on wages to rise. As workers realise they are more valued they hold bargaining power and drive up nominal wages. But as much as this is a benefit to workers, it causes firms production costs to rise and these costs eventually get passed onto consumers in the form of higher prices. Leading to the inverse relationship between unemployment and inflation. Below is a graphical depiction of the curve.


Display # 
Forgot your password?