The EzyEducation website uses cookies to help ensure we give you the best experience.
If you continue without changing your settings, we assume that you are happy to receive all cookies on the EzyEducation website.
Please refer to our Privacy and Cookies Statement to

find out more.

Continue

Economic Terms

All   0-9   A B C D E F G H I J K L M N O P Q R S T U V W X Y Z

Too Big To Fail Policy

This is the moral hazard problems that are created in the financial sector when large financial institutions (in terms of asset value) realise that any losses they make will be paid by the taxpayer they increase their propensity for risk. For example in the case of Northern Rock the Bank of England provided them with a £3bn bailout to keep them alive. However if large banks receive the guarantee that they will always be bailed out they have no incentive to stave off losses.


Total Costs (TC)

The sum of all costs of production.

Below is a diagram to show that the total cost curve is derived from the total variable cost curve and total fixed cost curve. As these are sepearate costs that face the firm, if at each output level both of these costs are added up the total cost for each level of output can be calculated and by connectng all of these points together the total cost curve can be derived, as shown below.


Total factor productivity

The efficiency of the productive process usually determined by measuring the units of output produced by all factor inputs. Increasing productivity is usually associated with periods of economic growth.

Total Fixed Costs (FTC)

The sum of all the fixed costs such as rent, loan payments and salaries.

Below is a diagram to show an example of a total fixed costs curve for an individual firm. As can be seen this curve is perfectly horizontal because these costs do not change regardless of how much output is produced and therefore this line will indefinitely continue until the firm either has a reduction or increase in the amount of fixed payments such as rent on a building.


Total revenue

The total revenue produced by the sale of a good. It is equal to the market price x the number of units sold.

Below is a diagram to show the level of revenue that a monopolistic firm makes. As can be seen this blue shaded region is equal to the market price multiplied by the quantity of goods produced. The level of sales revenue in this instance is quite large as the monpolist has significant market power and can charge a price above the marginal cost curve.


Total Variable Costs (TVC)

The sum of all the variable costs of production, such as materials, wages and transport.

Below is a diagram to show an example of a total variable costs curve for an individual firm. As can be seen this curve is linearly increasing at a proportionate rate because these costs are linearly increasing when more output is produced and therefore this line will indefinitely continue until the firm either has a reduction or increase in the amount of variable payments such as the amount each worker is paid or ho many workers they decide to hire.


Trade Creation

Trade creation is the term given to the increase in economic welfare that comes from a removal/reduction in trade barriers between countries. The increase in economic welfare is stimulated by a reduction in the price at which goods can be imported into the economy. Lower prices enable consumers to purchase and import more and result in consumption increasing (welfare gain). The efficiency of the market also improves due to inefficient domestic production being replaced, to some degree, by production from the most efficient producers. This improvement in efficiency, in turn, benefits the consumers in a particular market (welfare gain).

It is important to be able to visualise the impact of trade creation on any particular market which is subject to trade barriers. Below is the market for a particular commodity, with the welfare implications under an import tariff and under free trade (removal of tariff):

Tradecreation

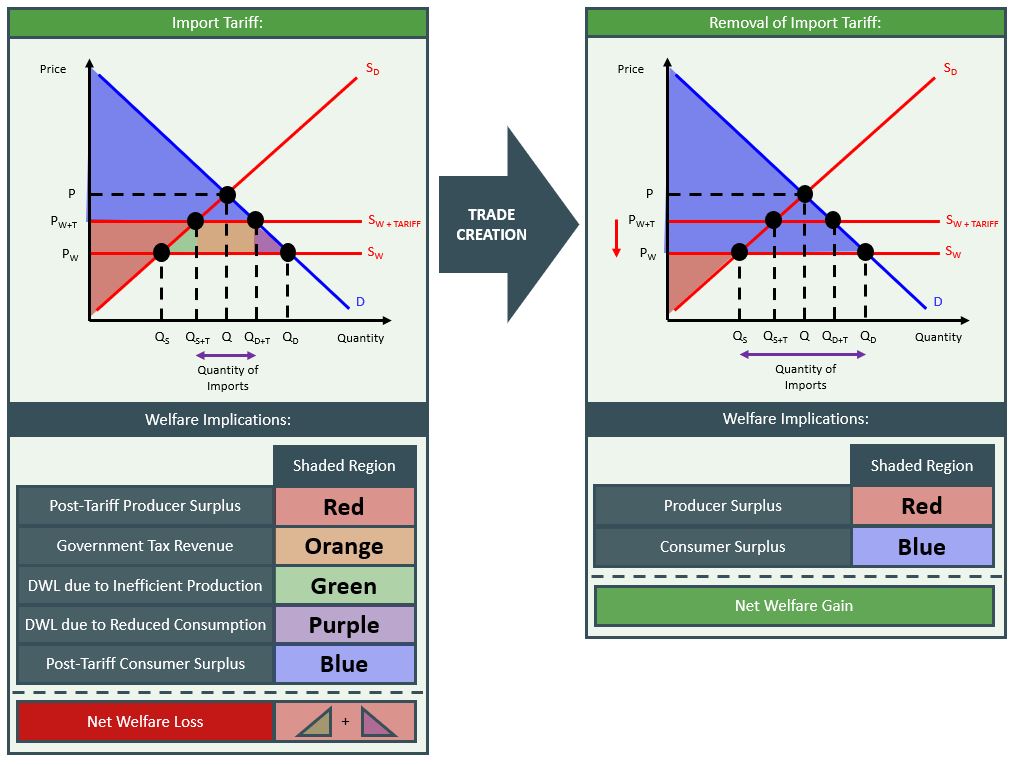
The removal of the import tariff forces the world supply curve of the commodity back down to SW and forces the price down to PW. At this price, foreign producers have more influence over the domestic market and more foreign goods are imported by domestic consumers (Q- QS). The welfare implications of this are that the two deadweight loss triangles are eliminated and transferred to consumers via an increase in consumer surplus (due to an increase in quantity demanded and a fall in price). The tax revenue box is also transferred from the government to consumers on the basis of the same logic. This diagram shows how the removal of a trade barrier has resulted in trade being created in the market and has resulted in an improvement in total welfare. This describes the economic rationale behind joining a free trade area such as the European Union.


Trade credit

When a supplier allows a customer to take possession of goods before actually paying for the goods.

Trade Diversion

Trade diversion is the term given to the negative trade implications that occur when a country joins a customs union or free trade agreement. The logic is that by joining the customs union, a country will have to import goods from a less efficient country due to the common external tariff that is imposed on goods traded outside of the union.

To explain this process let's consider a simplified example of a country joining the European Union. Before joining the union, the country could import a specific commodity from the United States at the price of PUS. This results in a large number of imports from the US (Q2 - Q1). However, after joining the union, a common external tariff is applied to any goods being imported from the United States. This forces the US supply curve up to SUS+T and the new US imported price is equal to PUS. This means now that the cheapest import option available to domestic consumers is to import the commodity from other EU countries. The price of PEU is lower than the price of importing the good from the United States under the common external tariff, but is above the actual price of the US commodity. This means joining the customs union, has diverted trade away from the US to the EU and overall trade has fallen in this particular commodity. This can be represented  by a net loss in economic welfare, as shown by the orange shaded region below:

Tradediversion


Trade in goods

Goods that are made in one country and sold in another.


Display # 
Forgot your password?