The EzyEducation website uses cookies to help ensure we give you the best experience.
If you continue without changing your settings, we assume that you are happy to receive all cookies on the EzyEducation website.
Please refer to our Privacy and Cookies Statement to

find out more.

Continue

Economic Terms

All   0-9   A B C D E F G H I J K L M N O P Q R S T U V W X Y Z

Command Economy

An economic system that operates in a different way to capitalism. The state decides what goods and services are produced and how they are distributed.

Commercial bank

An institution licensed to receive and hold deposits, that enables monetary transactions and creates credit. Deposits are used to finance loans that earn a high enough rate of interest to earn a profit after payment of interest to depositors and covering the cost of administration and bad debts.

Below is an illustration of the main activities that a commerical bank undertakes i.e. deposit-taking and lending activites to the retail and household sectors of the economy. They are often called intermediairies because they intermediate funds between surplus units (savers) and deficit units (borrowers).


Commodity markets

Markets that trade large quantities of raw materials e.g agricultural products such as wheat, sugar and cocoa and mined/extracted products like copper, gold, silver and petroleum.

Comparative Advantage

If a country experiences a differential absolute advantage in both goods this generates a difference in the opportunity cost of production and provides incentives for both countries to specialise and trade.

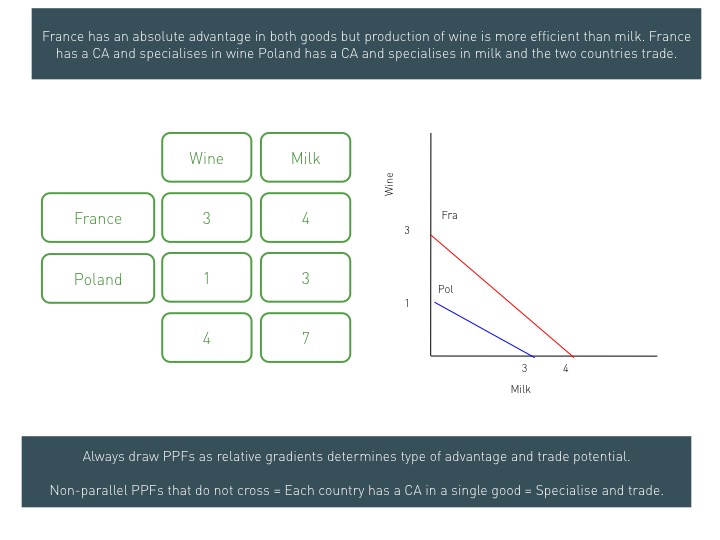
The following example demonstrates how although France has an absolute advantage in the production of both goods it does not benefit from a comparative advantage in the production of both goods. France has a comparative advantage in wine but not in milk as Poland has a comparative advantage in this product. This will become clear by calculating the opportunity cost of producing each good for each of the two countries.

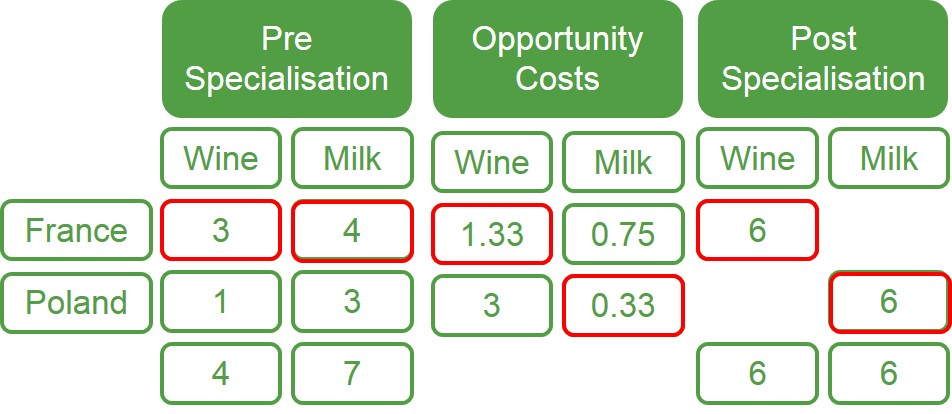
The opportunity cost = production gained /production lost. For example, if a country divides resources evenly between two goods and makes 3 wine and 4 milk it can make another 3 wine if it gives up 4 milk. So production gained is 3 wine / production lost is 4 milk. This means that the opportunity cost of producing 1 extra wine is 1.33 milk (i.e. 3/4). The table shows that France has the lowest wine opportunity cost and Poland has the lowest milk opportunity cost. France specialises in wine and Poland in milk.

If you find the calculations are challenging it is sometimes easier to start by drawing PPFs which are non parallel but do not intersect (see below). A Some students may find it easier to draw the graph and then analyse the relationship between PPFs to determine comparative advantages:

  1. The most efficient country (PPF furthest from origin = France) has a comp advantage in the good exhibiting the LARGEST difference in production i.e. the good plotted on the axis where the difference between the 2 PPFs is LARGEST = wine.
  2. The least efficient country (PPF closest to the origin = Poland) has a comp advantage in the good exhibiting the SMALLEST difference in production i.e. the good plotted on the axis where the difference between the two PPFs is SMALLEST = milk.


Competing supply

Situations where factors of production can be used to produce different goods so that an increase in the supply of one commodity requires a reduction in the supply of another commodity.

Below is a diagram to illustrate this in a supply and demand framework. In this instance farmers use their land to rear animals to produce products such as beef and lamb. However if farmers decide to use more land to rear cows to help produce more beef this causes the supply of beef to increase. However, as land is required to rear other animals such as land, if there is less land available to rear sheep then the supply of lamb will fall. This is all caused because of scarce supply of land.


Competition and Markets Authority

A new organisation formed to replace many of the functions performed by the Competition Commission and the Office of Fair Trading. The organisation becomes effective from April 2014. Its purpose is to promote competition and make markets work well for consumers, businesses and the economy.

Competitive demand

Markets where number of substitutes exist and one good can be purchased instead of another good.

Below is a diagram to illustrate two substitute products in a supply and demand framework. Beef and pork are both substitutes as most consumers class them as similar goods and very rarely buy both goods at the same time. A fall in the supply of beef creates excess demand and the price of beef rises, leads to a sharp fall in demand . However, because the price of beef is higher consumers to switch to a cheaper substitute (pork) and as a result this forces the demand for pork up as it is a key substitute to beef.


Competitive market

Are markets in which no individual buyer or seller can influence the market outcome.

Below is a diagram to illustrate a competitive market using a supply and demand framework. In this market an equilibrium price is reached by demand and supply equalising and the goods that are produced at this price get allocated to those consumers which value them the most. Any disequilibrium is soon cancelled out via market forces i.e. the price mechanism.


Complementary good

A good which is purchased alongside another good as the combined outcome helps to satisfy a want or desire e.g. milk and tea

Complementary goods

A good which is purchased alongside another good as they need to be consumed together to satisfy a want or desire.

Below is a diagram to illustrate complementary goods in a demand and supply framework. Pasta and pasta sauce are two goods which need to be consumed together and therefore are complementary goods. As the diagrams below show, an increase in supply of pasta leads to a fall in the price due to excess supply. If the price of pasta falls, demand increases for pasta but this will also cause the demand for pasta sauce to increase as they are complementary goods. Hence why the demand curve for pasta sauce shifts outwards.


Display # 
Forgot your password?