The EzyEducation website uses cookies to help ensure we give you the best experience.
If you continue without changing your settings, we assume that you are happy to receive all cookies on the EzyEducation website.
Please refer to our Privacy and Cookies Statement to

find out more.

Continue

Economic Terms

All   0-9   A B C D E F G H I J K L M N O P Q R S T U V W X Y Z

Complete market failure

When a market completely fails to provide a good or service. This is largely restricted to pure public goods e.g. defence.

Below is a diagram to illustrate market failure which is created with pure public goods such as national defence. There is market failure because despite a demand for these types of goods nobody in the market is willing to supply them because of the free-rider problem.


Composite demand

A situation where a good is demanded for a variety of different reasons e.g. timber is demanded to make houses, furniture, paper and many other purposes.

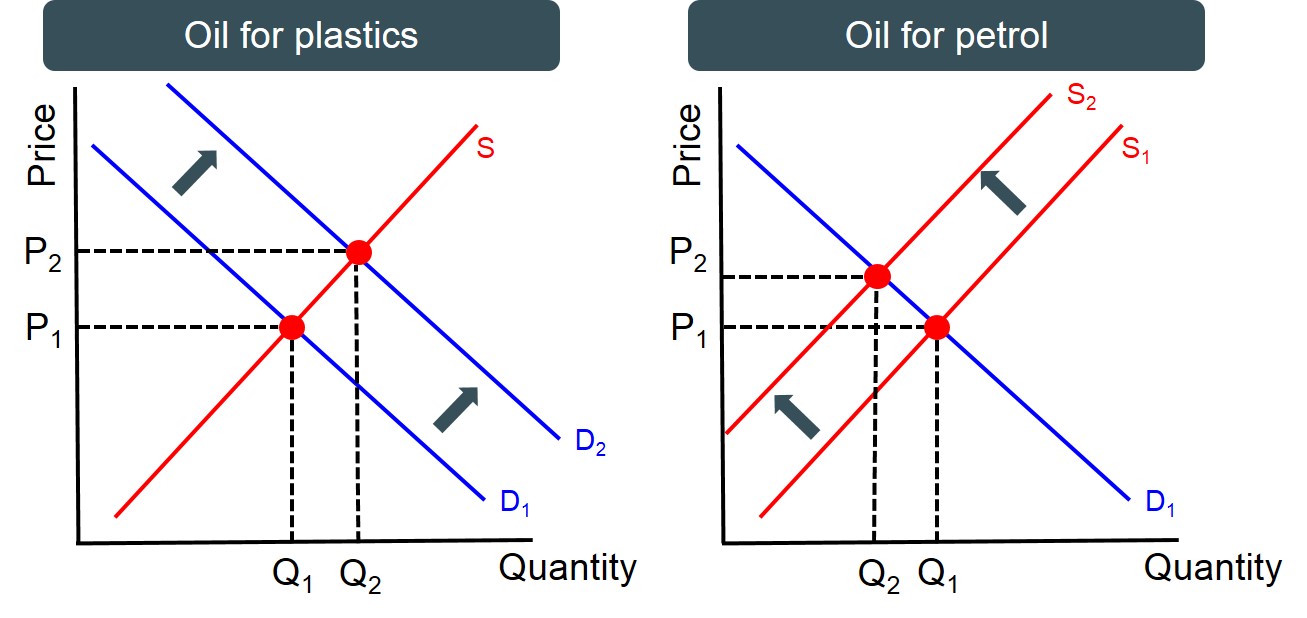
Below is a diagram to illustrate composite demand for a product that has many uses in alternative markets, oil. In the diagrams below an increase in demand for oil from plastic producing firms, has to result in a fall in the supply of oil in the petrol market as oil is a composite product has lots of alternative uses. This logic could be applied to other products such as bread and steel.

composite demand


Compulsory break up

A form of regulation when companies are forced to down size by selling parts of their business e.g. The EU ordered Lloyds Bank plc to sell parts of their retail banking business after it merged with HBOS plc.

Concentration Ratio

Summarises how much of the entire market the largest firms control.

Below is an illustration of how to calculate a specific n-firm ratio. In this case to find the 3-firm concentration ratio (the combined market share of the three largest firms) all that is required is to identify the three firms with highest market share and add these sums together as shown. The fact that the ratio is 77%, signifies that this is not a very comeptitive market as these three firms control over three quarters of the market.


Congestible public good

These are public goods that become rival when they are heavily used e.g. during rush hour the usage of roads by each additional car causes congestion that diminishes the utility of other drivers. By charging a toll to control congestion the good becomes excludable during toll hours.

Congestible public goods

These are public goods that become rival when they are heavily used e.g. during rush hour the usage of roads by each additional car causes congestion that diminishes the utility of other drivers. By charging a toll to control congestion the good becomes excludable during toll hours.

Conglomerate Integration

Type of integration referring to the mergers or acquisitions between busineses which operate in different markets.

Below is a graphic to illustrate the perceived benefits of a conglomerate merger and the possible motives behind firms involved in the merging process. The idea is that just like stock portfolios the best strategy is to diversify to minimise risk i.e. to move into as many markets as possible, so if one market collapses the exosure to risk is low and any losses can be offset by gains in the other markets. This type of integration can also foster innovation and invention by allowing new ideas and approaches to be implemented from agents that specialise in different markets. Finally the larger the company the more economies of scale opportunites are available and that can only benefit the profit channel of the companies involved.


Constant Returns to Scale

When a firm increases all the factors of production by a factor and output increases by an equal factor. As a result the average cost for the firm stays constant.

Below is an illustration of how a business would achieve constant returns to scale. Assuming this firm only uses capital and labour as its inputs. A doubiling of the capital and labour input leads to a doubling of output as well. Because the average cost is calculated by the total costs/output, if the costs are increasing proportionately with output, average costs do not change.


Consumer good

Are consumed to satisfy the personal wants and needs of consumers. They are not used to produce other goods in the way that capital goods are.

Consumer goods

Are consumed to satisfy the personal wants and needs of consumers. They are not used to produce other goods in the way that capital goods are.

Display # 
Forgot your password?