The EzyEducation website uses cookies to help ensure we give you the best experience.
If you continue without changing your settings, we assume that you are happy to receive all cookies on the EzyEducation website.
Please refer to our Privacy and Cookies Statement to

find out more.

Continue

Economic Terms

All   0-9   A B C D E F G H I J K L M N O P Q R S T U V W X Y Z

Labour Productivity

The amount of output per unit of labour.

Below is a diagram to show the growth in UK labour productivity since 1960. It has been growing close to a linear trend.

Source: ONS


Laffer Curve

A curve showing how the amount of tax raised varies with the percentage rate of tax levied. It shows that although there is a positive relationship between the tax rate and revenue at low percentage rates of tax, the tax raised ultimately reduces when the percentage rate starts to rise to high levels, as this discourages workers from providing additional labour or encourages individuals to avoid paying the tax.

Below displays the typical shape of a Laffer curve and highlights that all economies have an optimal tax rate and this tax rate exists at point a in the diagram below. Perversely, in this instance if the tax rate is increased to point b the level of tax revenue falls, this is the key insight behind this curve. Because if the tax rate becomes too high workers lack the incentive to work.


Land

The factor of production that not only covers land but also the sea and anything that can be extracted from it (mining and fishing) or produced using the land (farming and forestry). It does not include any property built on land. Rent is the reward paid for the use of this factor of production.

Law

A theory that is supported by extensive empirical research.

Law of Demand

This is the theoretical explanation of why the demand curve for most goods and services is downward sloping i.e. an inverse relationship between the price of a good and the quantity demanded of that good.

This is best explained by the fact that when there is a change in the price of a good it affects the ability and willingness of individuals to consume the good at the new price. For instance, if the price of the good falls, more individuals are able to consume the good as it now fits into their affordability range. Also, some consumers that could afford the good before the price change, but were not willing to purchase the good at the original price because it was beyond their own value placed on the good, may well be incentivised and encouraged to purchase the good at the new lower price. The combined effect of these two consumption channels leads to the quantity demanded for the good or service in question to increase in response to a price fall. 
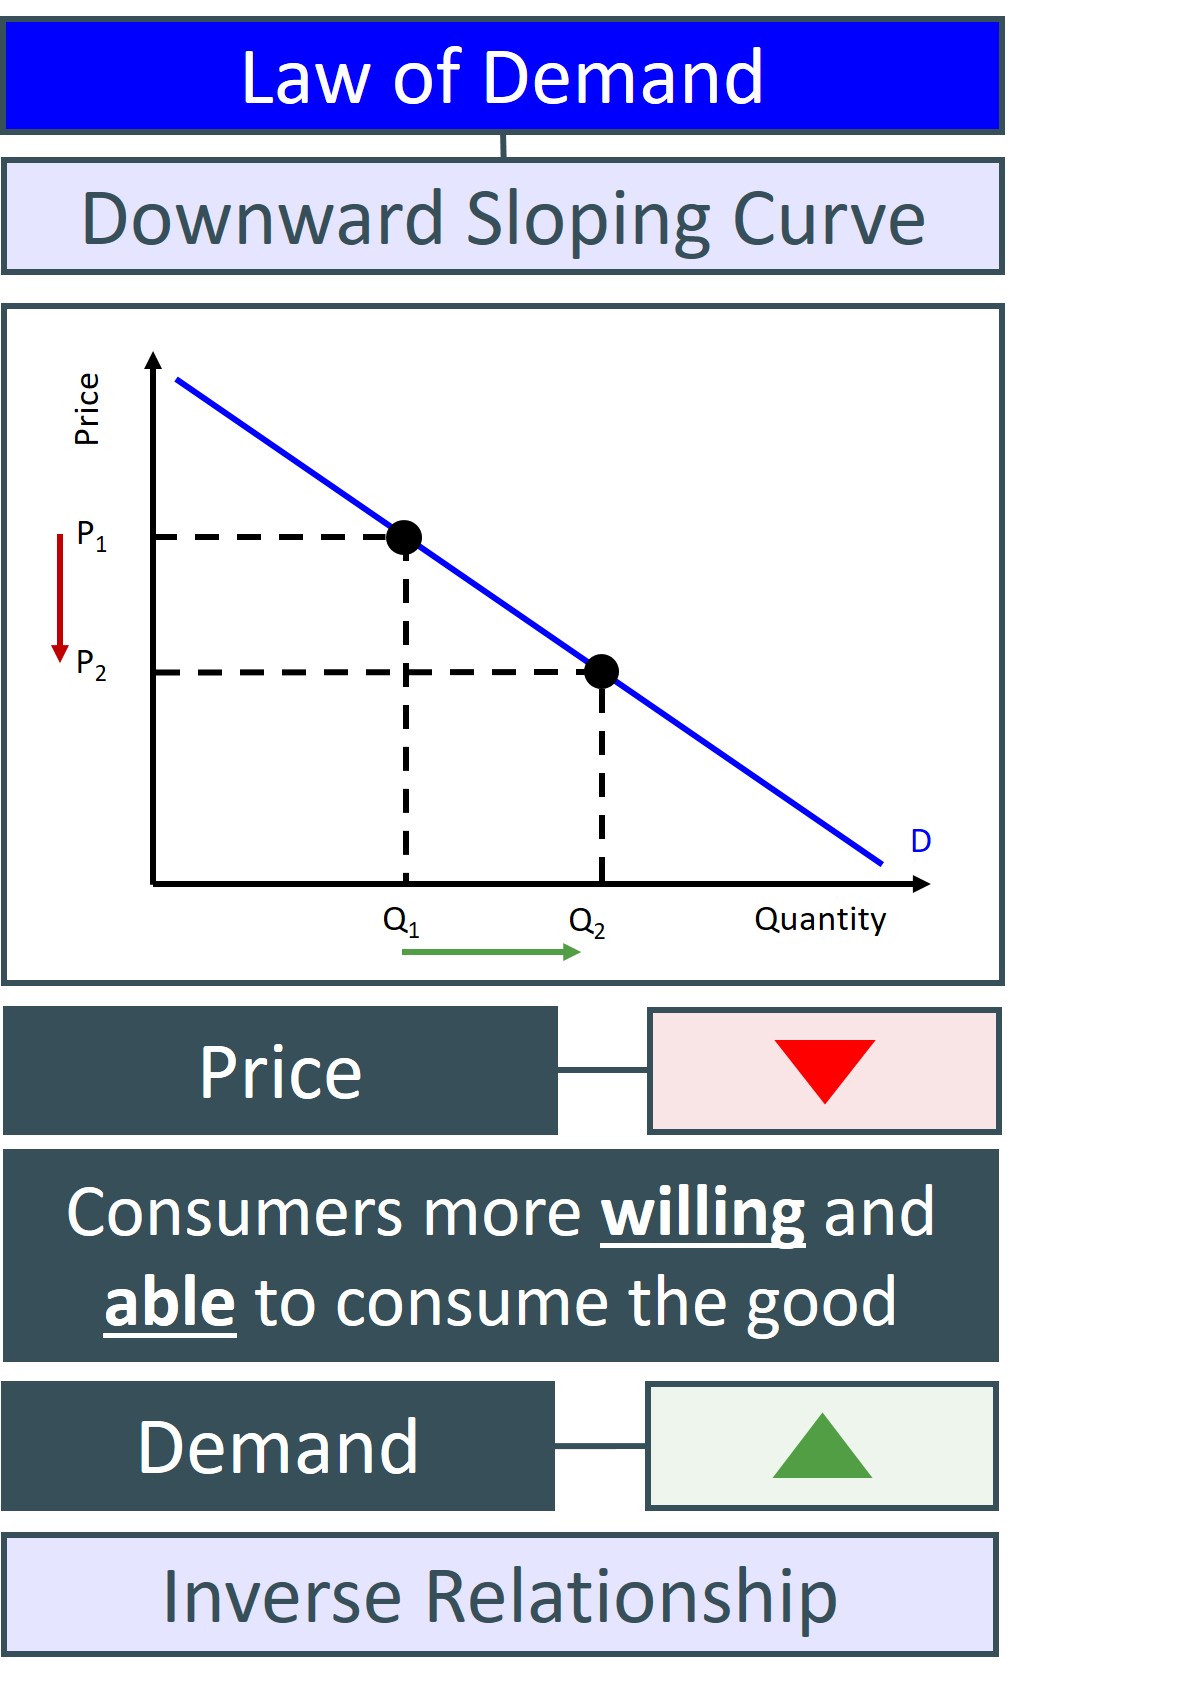
                    

The only case the law of demand does not hold for a particular good is when we are considering a veblen good. In this rare and often theoretical case, demand actually rises with the price of the good.


Law of Diminishing Marginal Returns

A firm in the short-run will eventually experience diminishing marginal returns i.e. as the firm keeps on adding a flexible factor (labour), the amount the additional resource can produce decreases.

Below is an example of how the law of diminishing marginal returns can be illustrated both graphically and numerically. The marginal product is positive for each additional worker, which emphasises that each worker is contributing to the level of output for the firm. But this marginal product starts increasing at a decreasing rate after worker 2. This does not mean that any workers employed after worker 2 is less productive and less efficient but just that the conditions in the workplace for this firm to absorb extra workers without additional capital and infrastructure is restricting the amount of output future workers can make. For instance, if a bakery shop keeps employing new bakers without increasing the number of ovens available for bakers to use will mean that the value of each additional baker hired in terms of output will be lower, as each of the bakers are having to queue up to use each of the ovens.

Therefore, given that this law exists this causes the marginal cost curve to have the shape that it has below. This is because the marginal product is rising for the first extra workers hired and therefore the marginal cost is low. But as the marginal product belonging to each worker begins to fall the marginal cost begins to rise as the firm moves closer and closer towards full capacity.


Law of Diminishing Marginal Utility

This is an economic law that states that the marginal utility received decreases as a consumer buys more units of a good. This happens because in the eyes of the consumers the value of the good diminishes for every extra unit they buy e.g. a chocolate bar. However, this does not mean that consuming an extra unit does increase total utility, just that it may not add as much utility as the previous units.

Below illustrates the declining utility for a consumer for every additional chocolate bar they consume but total utility continues to increase.


Leakages

Negative flows out of the circular flow of income generated by payments for imports, taxes and savings.

Below is an illustration of some of the most common leakages which draw money out of the circular flow of income and expenditure towards foreign entities. The most obvious example of this is the demand for a foreign country's imports, as well as forms of savings being placed in foreign financial institutions.


Lender of last resort

The main role of the Bank Of England. In the event that banks or the government is not able to borrow money from commercial markets the Bank of England is required by law to make finance available e.g. if the markets do not take up the offer of a new issue of gilts by the UK government, the Bank of England is legally obliged to do so.

Liabilities

The claims that agents have on the bank and these are used to finance the banks asset purchases.


Display # 
Forgot your password?