The EzyEducation website uses cookies to help ensure we give you the best experience.
If you continue without changing your settings, we assume that you are happy to receive all cookies on the EzyEducation website.
Please refer to our Privacy and Cookies Statement to

find out more.

Continue

Economic Terms

0-9   A B C D E F G H I J K L M N O P Q R S T U V W X Y Z

Availability Bias

Is a mental shortcut that relies on immediate examples that come to a given person's mind when evaluating a specific topic, concept, method or decision.

This is a cognitive bias as individuals tend to over-estimate the probability of an event occuring the more easily they can recall examples. For instance to put this bias to the test in an experimient individuals were asked to state which of the two options was more likely 'words beginning with k' or 'words where the third letter is k'. Most individuals wrongfully chose the former option as it is much easier to recall words that start with the letter k than it is with words where the thrid letter is k. Another example of this is to ask individuals to evaluate the probability of an airplane crash as the diagram below shows.


Average cost

The cost per unit of output. This is calculated by total cost divided by units of output. The table below shows the calculation of the average cost per unit for a firm for different levels of output and costs.


Average cost curve

A curve drawn to connect the average costs of production at every level of output. The curve will be U shaped and the lowest point will be the Pareto efficient point. This identifies the output producing the lowest average cost (productively efficient output).

Below is a diagram to illustrate the basic shape of the average cost curve. The section of the graph in which average costs are falling is when the firm is experiencing economies of scale and the red section of the graph is when the firm is experiencing diseconomies of scale. Therefore as the graph illustrates firms should be aiming to produce at the quantity that yields the minimum of this u-shaped curve i.e. producing too much leads to excess costs, inefficiency and diseconomies of scale.


Average costs

The cost per unit of output. This is calculated by total cost/units of output.


Average Fixed Cost (AFC)

Is the average fixed cost per unit of output produced.

Below is an illustrated example of how to calculate the AFC for different levels of output for a hypothetical firm. These points can then be used to map out the AFC curve for this firm.


Average propensity to consume

The proportion of income that consumers are likely to spend.

Average propensity to save

The proportion of income that consumers are likely to save.

Average Variable Costs (AVC)

The average variable cost per unit of output produced.

Below is an illustrated example of how to calculate the AVC for different levels of output for a hypothetical firm. These points can then be used to map out the AVC curve for this firm.


Bad Good

Is a good that when consumed yields disutility i.e consumption is unpleasant or does not lead to satisfaction or positive utility. For example if a consumer consumed expired food that makes you ill, this would be an example of a bad good as after consumption the consumer will have less utility than before. In effect these goods ar just opposites of a normal good.

However, there is some subjective judgement over whether a good is beneficial to consume or in fact it leads to reduced utility. For instance, even though the health effects of smoking can make smoking a bad, smokers believe they enjoy smoking which make it a good at the time of consumption.


Balance of payments account

A financial document that measures a country’s economic activities with all other countries over a period of time. These documents are made up of two different accounts: Current Account and Financial Account.

The current account is a main measure of trade of goods and services between other countries and therefore is a sign of the relative competitiveness of a country to the rest of the world. The financial account is a measure of financial flows between countries such as trades of financial assets. These documents must balance and therefore if a country is running a large deficit on one of the accounts then they must have a similarly large surplus on the other account to make the balance of payments 'balance'.

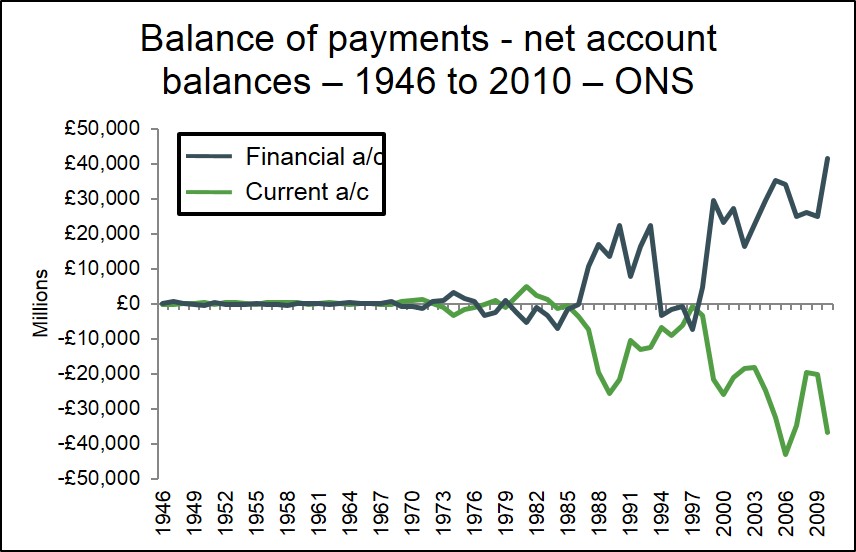
The diagram below shows the UK's balance of payments position from the years 1946-2010. The most striking image from this diagram is that the UK have been continuing to finance a growing current account deficit with a growing financial account surplus i.e. selling financial assets to borrow money to finance the deficit on goods and services to live beyond ther means. 


Display # 
Forgot your password?