The EzyEducation website uses cookies to help ensure we give you the best experience.
If you continue without changing your settings, we assume that you are happy to receive all cookies on the EzyEducation website.
Please refer to our Privacy and Cookies Statement to

find out more.

Continue

Economic Terms

0-9   A B C D E F G H I J K L M N O P Q R S T U V W X Y Z

Transmission mechanism

A model that explains the impact of monetary policy on an economy. Below is a simplified version of the transmission mechanism to identify the main channels in which a change in the base rate ultimately affects the economy.

First of all it is important to identify that when the base rate changes this also affects all the other interest rates in the economy - both short and long-run - which will make changes to the availability and ease at which businesses and consumers can acquire credit. For instance if the base rate is cut this should lead to cheaper borrowing from banks to customers. Which in turn fuels higher consumption and investment contributing to higher demand.

This base rate cut will also cause asset prices to surge as asset's become more valuable when deposit interest falls.

A cut in the base rate also causes the exchange rate to depreciate and the domestic currency gets weaker relative to foreign currencies because of hot money flows out of the economy. This makes exports cheaper and imports more expensive, boosting a country's trade position and AD.

All of these effects accumulate and create inflationary pressures in the economy. Higher interest rates will have the opposite effect and will reduce inflationary pressure. Central bank's are able to influence the rate of interest in the economy and use this as the main policy tool for regulating the rate of inflation.


Trend Rate of GDP growth

This is the average growth rate in real GDP over a period of time.

Below is an illustration of the theoretical growth rate for an economy in its economic cycle. This the level of GDP growth that a country should be achieveing if the peak and trough phases of the business cycle have been averaged out.

Between 1948 and 2012 the UK economy has achieved trend growth of 2.6% p.a. compound. The highest annual rate of growth was 7.4% in 1973 and the lowest was -5.2% in 2009.


Trilemma

This represents the difficult choice that all policymakers face when setting domestic policies. That is, many countries would consider it desirable to have a fixed exchange rate, capital mobility and monetary policy autonomy, butis it is only possible to achieve two of these objectives.

The diagram below illustrates the trilemma and the fact that policymakers face a trade-off between these policies and the optimal decision to make would be to sacrfice the least beneficial objective given their particular circumstances. The logic with the diagram is that the policy objective that a country decides to pick the opposite corner of the triangle to that objective mst be sacrificed whilst the two adjacent policies to this objective can be take on.

For instance if a country wanted to pursue a fixed exchange rate i.e. goal 1. Then they would have to sacrifice having a floating exchange rate whilst at the same time having to implement capital controls and losing their own monetary policy autonomy.


Trillion

1,000,000 x 1m or 1,000 x 1bn

Trough

A sustained period of low economic growth which usually follows a recession and is usually associated with:

  • Low growth
  • High unemployment
  • Low inflation
  • Low levels of confidence

  • Underwriting

    Is where a bank sets a price at which new securitites will be issued onto the market, with some banks guaranteeing that they themselves will buy up the rest of the shares if they fail to sell at that price. This is one of the main traditional activities of investment banks and this is the main way that they aid their customers to raise finance for their own personal investment projects.


    Unemployment

    Is a term that applies to individuals that are of working age, but currently do not have a job and have been actively seeking employment.

    In most cases, unemployed people are individuals who are willing and available to work but often cannot find a job that matches their preferences. If an individual is unemployed they still make up part of the labour force as they are likely to continue to contribute towards the economy for most of their working life.

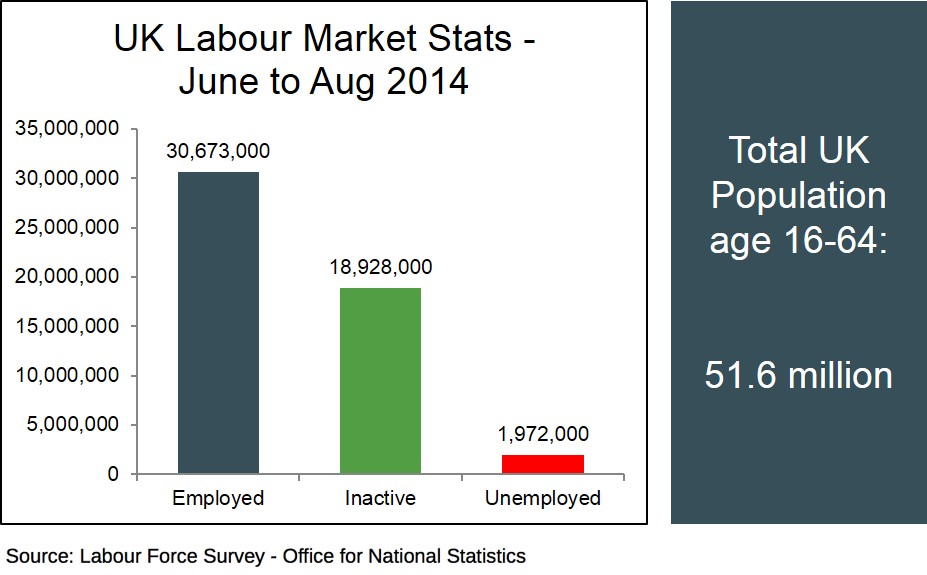
    In the UK, the official measures of unemployment and employment is measured using the Labour Force Survey - which is a household survey of the current employment positions of agents. 

    Below is a breakdown of the amount of workers who were classed as employed, unemployed or outside the labour force and economically inactive in the UK from June to August 2014. This measurement is taken using the government's Labour Force Survey.

    There are many different forms of unemployment in an economy:

    • Cyclical unemployment
    • Structural unemployment
    • Frictional unemployment
    • Seasonal unemployment
    • Real wage unemployment (Classical unemployment)

    Unemployment is used as an indicator to judge how strong and robust an economy is and if the unemployment rate is close to the natural rate of unemployment then this is a sign the economy is close to full employment and as a result any further expansions in the economy in the short run will introduce inflationary pressures in the economy. This is why Central Banks of a country always use unemployment data when making their decision on interest rate changes in the economy. 

    Low unemployment is an economic aspect that all governments aspire to achieve because it creates a high level of confidence in the economy which can spur on economic growth and investment. It can also improve the budget position of the government by improving the inflow of tax revenue whilst simultaneously reducing the level of benefits required to be paid out. Low unemployment also satisfies one of the main macroeconomic objectives for the government but it could simultaneously create a conflict with other objectives. The most notable one is the trade-off between unemployment and inflation that is displayed in the Phillips Curve. It can also create problems on the current account position of a country as higher consumption fueled by greater confidence can increase consumption of imports.

    It is important to note that unemployment is not always as negative for an economy as it seems. For instance, a high level of unemployment increases the pool of available workers for firms to employ and this creates the potential for these firms to expand, adding to the productive capacity of the economy. Also with persistent unemployment some workers may become disillusioned with the labour market and decide to go down the self-employment route and by doing so could increase entrepreneurial innovation and activity in the economy, which is beneficial for an economy. 

    Another evaluation point to consider regarding unemployment is that if we have a situation where output falls, it does not always feed into higher levels of unemployment because of important time lags between the economic cycle and the unemployment cycle i.e. firms will postpone laying off workers until they are sure that an economic downturn is likely to be sustained. In some cases firms may even engage in labour hoarding - where they keep their workers on the payroll during an economic downturn, ready to re-employ when the economy recovers.


    Unemployment trap

    When individuals who currently do not have a job do not perceive any benefit in working as the earnings received after taxes is not sufficient to replace the welfare benefits given up when they accept a job. 


    Unintended consequences

    When a government intervention has an impact (usually negative) that was not intended when the policy was implemented e.g. favourable taxation of fuel efficient cars has achieved environmental benefits but has reduced the total tax revenue arising from vehicle licence duty.

    Unit elastic supply

    When the proportionate change in supply is equal to the proportionate change in price. In this case the PES value will be equal to 1.

    Below is a diagram to show the characteristics of a unit elastic supply curve:

    The supply curve has the typical upward sloping relationship between quantity supplied and price, as a result of the greater profit incentives that arise from higher prices. But with a unit elastic supply curve, quantity supplied and price change by the same factor when moving along the supply curve. 


    Display # 
    Forgot your password?