The EzyEducation website uses cookies to help ensure we give you the best experience.
If you continue without changing your settings, we assume that you are happy to receive all cookies on the EzyEducation website.
Please refer to our Privacy and Cookies Statement to

find out more.

Continue

Economic Terms

All   0-9   A B C D E F G H I J K L M N O P Q R S T U V W X Y Z

Aggregate demand curve

The curve that shows the total quantity of goods and services demanded (real output) at different price level (s).


Aggregate supply

The total supply of goods and services at any given price level over a given period of time.

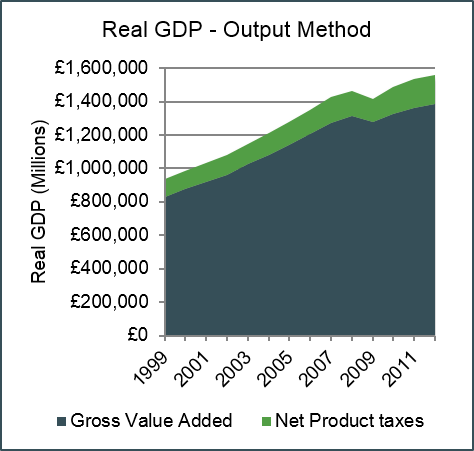
This is usually measured using GDP using the output method. Value added is based on the value of final output in the economy less the cost of inputs used up in the production process. Final output represents the finished goods, excluding intermediate goods, which are inputs used in the production of finished goods or services.

If the final product is a car, the intermediate goods/inputs will be goods such as the car components, electricity and advertising purchased to produce the car. As the value of the final good (the car’s price) reflects both the value of its inputs (the tyres) and the engineering expertise of the manufacturer, adding the final output of the tyre manufacturer to final output of the car manufacturer together would overestimate GDP.

To avoid this double counting, the value added at each stage of production is calculated. These items are then aggregated to produce a figure for each production process and then the whole economy so that the figure reflects the gross value added (GVA) by all productive processes. This measure is referred to as GDP at market prices.

As the value of the final output includes the net effect of product taxes (product taxes less any subsidies provided) this value is calculated separately. If the net effect of product taxes is removed from the estimate of GDP it is referred to as GDP at basic cost. 


Aggregate supply curve

The curve that shows the total quantity of goods and services supplied at different price levels.

The diagram below shows the aggregate supply curve in its two time dimensions i.e. the short-run and long-run:

  • The SRAS curve captures the direct short-run relationship between real output and the price level.
  • The LRAS curve shows that in the long-run unless there is a change in the size or productivity of the factors of production employed, supply will always exist at the full employment level and will not vary with the price level, as the economy is at full capacity.

The diagram below illustrates the Keynesian AS curve. Unlike the classical view, the Keynesian view is based on a single AS curve with variable elasticity at different points to reflect the level of spare capacity in the economy at a particular point in time:

The Keynesian AS curve is perfectly elastic when there is substantial spare capacity but becomes progressively more inelastic as spare capacity diminishes. It is actually perfectly inelastic at the full employment level when there is no spare capacity remaining. The change in the elasticity of the AS curve means that the impact of AD shifts will result in differential outcomes for price level and real output. 

This has important implications for predicting the outcome of economic policies. This is a useful evaluative tool that can be used in exams as this curve shows that the significance of a change in AD depends on the level of spare capacity in the economy at a particular point in time. It also provides a nice contrast with the outcomes predicted under classical theory. 

The graphic below indicates the varying impact of an AD outwards curve shift would have on the price level and real output of the economy at a particular point in time depending on the segment of the Keynesian AS curve the economy is situated on. 


Allocating function of prices

As the price mechanism determines what consumers spend their money on it also determines how scarce resources are allocated (used). Prices have three seperate functions: rationing, signalling and incentive functions. These ensure collectively that resources are allocated correctly by co-ordinating the buying and selling decisions in the market.

Below is a diagram to illustrate how the price mechanism works in a supply and demand framework. In this instance, an increase in demand for a product forces producers to produce more of the product due to the higher profit incentives. This is because the excess demand (from a positive demand shift) forces the price up and therefore the producer knows that for selling each product they will receive a higher average level of revenue per unit. Therefore the higher demand is signalling to individuals to allocate more resources to producing this type of good.

So in summary prices serve to ration scarce resources particuarly when a disequilibrium exists. If there is excess demand, the price increases - forcing only the consumers who have the absolute desire and willingness to purchase the product. This often occurs for goods such as sporting tickets, where there is a limited supply but high demand.


Allocative efficiency

When resources are optimally distributed so that consumer surplus is maximised i.e. quantity demanded is equal to quantity supplied.

Below is a diagram to show the allocatively efficient point in a demand and supply context. At this point, resources are being distributed in the most efficient way and social welfare is maximised (producer surplus + consumer surplus). There is no other price that exists in which consumer surplus is maximised and no dead weight loss triangle is present at this point.

It is important to note that the position of the allocatively efficient point and whether it is achieved by the market will depend on the market structure that you are considering. For instance, in a monopoly market the allocatively efficient point will never be met as the firm has enough market power to extract as much profit from the consumers as possible - constraining consumer surplus and social welfare. 

Allocative efficiency can also be highlighted by using a PPF diagram but only if further information about consumer preferences and tastes is made available. This is because there are many points that lie on the frontier and only one of these points can be allocatively efficient, as only one production point will satisfy consumer's preferences and produce the optimal allocation of resources, despite all production points on the frontier being productively efficient. 


Allocatively inefficient

Where resources in the economy are not distributed optimally and therefore consumers cannot purchase the quantity of goods that they desire. This occurs when the price is not equal to the marginal cost for firms and also the economy is operating on a point that does not lie on the PPF.

The diagrams below illustrate how graphically allocative inefficiency can be illustrated for firms and the economy as a whole. For firms, if they are producing at the point where price is not equal to the marginal cost, they are producing a sub-optimal amount of resources for consumers, the market shown below is a monopoly market, as this is a market with a high level of inefficiencies due to monopoly power.

The diagram on the right illustrates that when an economy is not producing on its PPF it is not using all the resources in the economy to produce a share of goods for economic agents to consume. Any point not on the PPF corresponds to an allocatively inefficient point.


Altruism

The disinterested and selfless concern for the well-being of others.


Anchoring Bias

Is a cognitive bias that describes the common human tendency to rely too heavily on the first piece of information offered (the "anchor") when making decisions. During decision making, anchoring occurs when individuals use an initial piece of information to make subsequent judgments.

For instance if individuals were asked whether the tallest building in the world was more or less than X amounts of ft, the mean answer given would be influenced by the x value given to them. As individuals use that information to sway their guess.


Appreciating exchange rate

A rise in the value of a currency due to excess demand for the currency. This will result in higher export prices and lower import prices.

In this example an increase in exports has increased the demand for the currency from D to D1. Without any change in supply to accommodate this demand this means the excess demand increases the exchange rate (the price of the currency) fro P to P1. At a price of P1 the exchange rate has appreciated and the movement up the supply curve means that the equilibrium is re-established as D1 = S.

Foreign currency is possibly the best example of how the forces of demand and supply operate, as vast amounts of currnecy are traded around the clock. Market makers will continuously adjust currency rates (the price of a currency) to clear the market by balancing prospective buyers and sellers. If there are more prospective buyers than sellers this means the price is too low and market makers will respond by gradually raising the price. The respective laws of demand and supply means that this price rise will disincentivise demand and incentivise supply until the market finally clears when the price reaches the point where demand equals supply. This is how exchange rates appreciate. 

An appreciation in exchange rate can be caused by:

  • An increase in demand - because foreign countries require sterling because they wish to acquire UK goods and services or they wish to move their savings to the UK.
  • A reduction in supply - because UK firms and individuals supply sterling to acquire foreign currency so they can purchase imports or to move their savings to other countries. 


Arbitrage

Making a profit by identifying opportunities to buy an asset in one market and to sell it on in another market at a higher price. The flowchart below illustrates the process of arbitrage for an investor to make an instant risk-less profit. Profit can be achieved without risk because the price differences occur at the same point in time which means that the respective trades can occur at the same time to exploit the price differential and make a profit.

The price differentials normally occur due to technical reasons e.g. a financial asset is traded in two locations (e.g. London and New York) and a temporary and unintended price differential emerges. These differentials are usually correctly quickly and so arbitrage opportunities must be identified and exploited quickly. Various software applications support this process. Although the price differentials are small and apparently trivia, large levels of profit can be made by applying large sums of money to exploit a small price differential.


Display # 
Forgot your password?