The action of selling the same product to different groups of people (or in different circumstances) for different prices. This is done so that firms can convert as much consumer surplus into revenue and profits.
There are three different forms of price discrimination that firms can choose from:
- First Degree Price Discrimination - charging consumers the maximum price they are willing to pay for
- Second Degree Price Discrimination - charging consumers different prices based on the quantities consumed
- Third Degree Price Discrimination - charging consumers different prices based on the type of market segment they are in
However, producers only have the ability to set these forms of price discrimination if certain conditions in the market hold:
- The firms involved must be price makers to ensure that they can set the appropriate price that fits into their pricing strategies. Therefore, price discrimination is a strategy that can only be used if the market is imperfectly competitive. The more market power an individual firm has, the more successful price discrimination is likely to be for the firm. In a perfectly competitive market, price discrimination cannot take place because all firms have to take the current prevailing price as given.
- The firm involved must be able to segregate the market into different types of consumers. Price discrimination is unsuccessful in markets that cannot be segregated because it allows the resale of the product from one consumer to another. This means that consumers who can purchase the product at a low price and then go on to sell their product onto a consumer that was facing a higher price. This is not the case for train tickets as children are charged a lower price than adults and cannot sell this ticket onto adults because of the fact that the markets has been divided into two sub-markets. Firms can segregate the market by dividing consumers up into different types based on: the time of consumption, gender, age, income status, location and consumption preferences.
- The consumers that are sold a product must have different price elasticities of demand, so that the firm can charge the consumers that are willing to pay a higher price a higher price, but for consumers who are not willing to pay a high price will be charged a lower price, so that encourages more consumers to consume. Therefore the elasticity of demand for consumers signals to firms how reluctant certain consumers are for paying a high price i.e. inelastic demand signals to the firm a high price and elastic demand signals to firms a low price.
The most common example of price discrimination is third degree price discrimination in which firms identify different types of consumers and a separate price is charged to each of the type of consumers e.g. train, cinema and theme park tickets.
Price discrimination diagrams can often be quite complicated to draw so the best way to draw these types of diagrams to remember a step by step procedure in which a new element on the diagrams is placed on at each step to make sure all elements of the price discrimination diagrams have been drawn. Below we are going to show the step by step process that needs to be taken to highlight the impact of third degree price discrimination on the different sub-markets as well as the firm. For this particular case we are assuming that the firm involved is a monopolist and the conditions that are required for price discrimination are satisfied and the monopolist has segregated the market into two sub-markets - A and B.
For the step by step process, the new elements added in at each stage will be highlighted in red and the stage achieved at the previous stage will be highlighted in black.
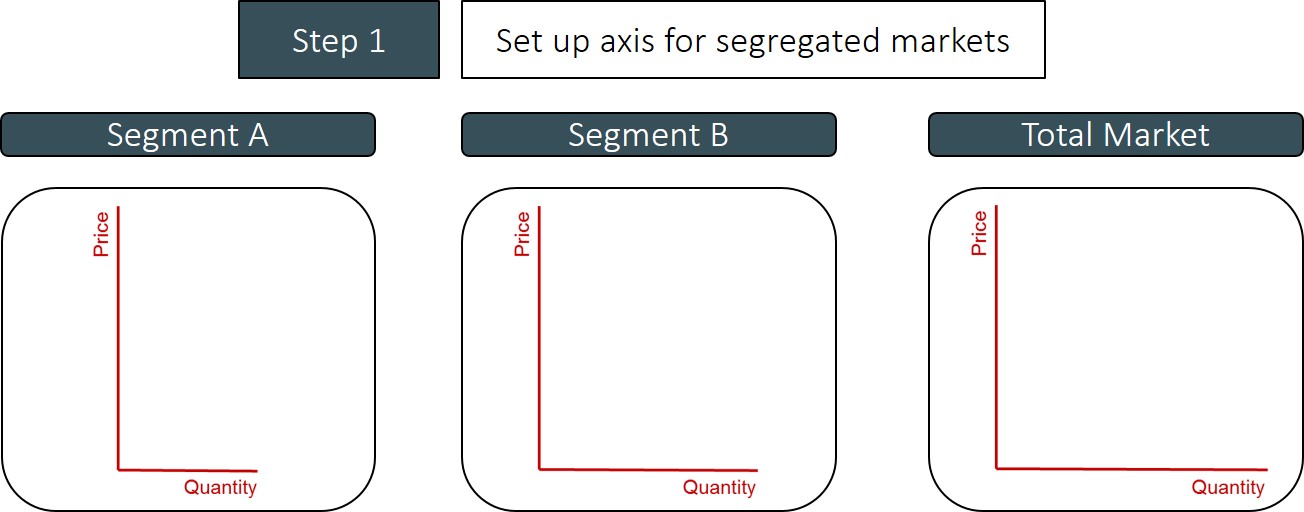
This step involves setting up the diagrams. As this is a micro diagram for a a specific diagram the x axis represents quantity and the y axis represents price.
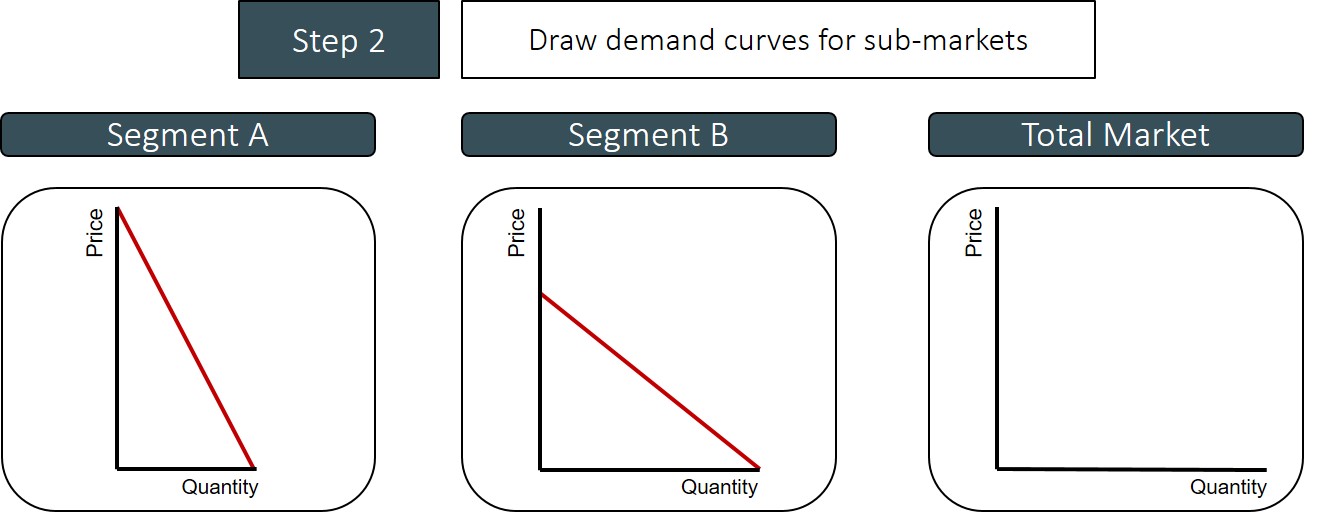
This step concerns drawing the two separate demand curves for market segment A and B. The monopolist splits the market into two sub-markets based on the fact that the consumers in the two sub-markets have a different elasticity of demand. Sub-market A faces an inelastic demand curve and sub-market B faces and elastic demand curve.
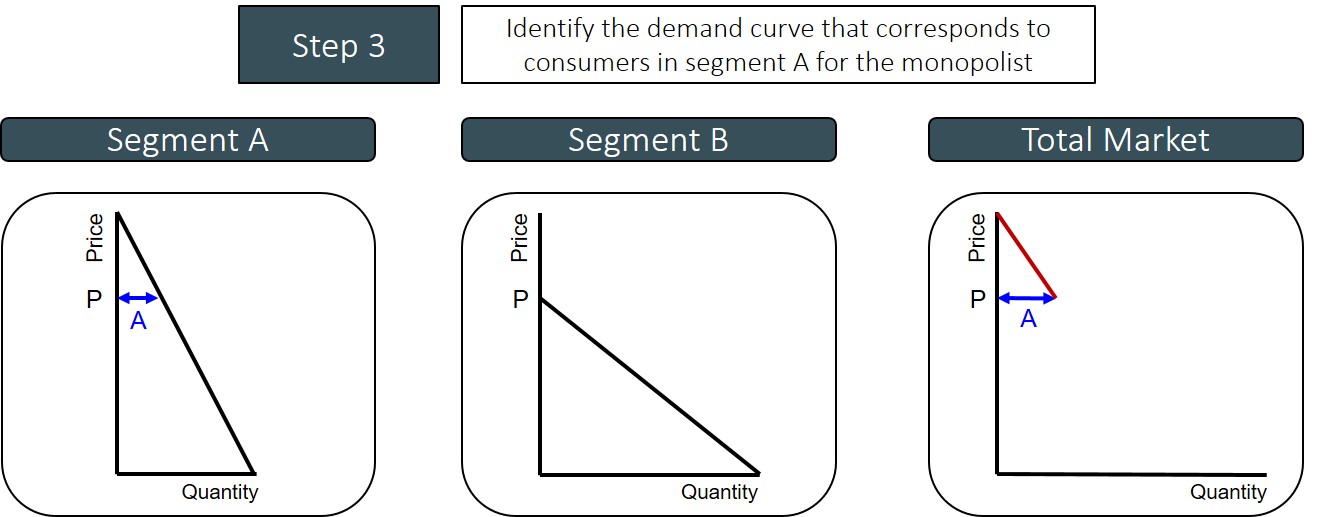
At any price above P, there are no sales to market B, so therefore at P and above the monopolist demand curve follows the same shape as the demand curve for market A.
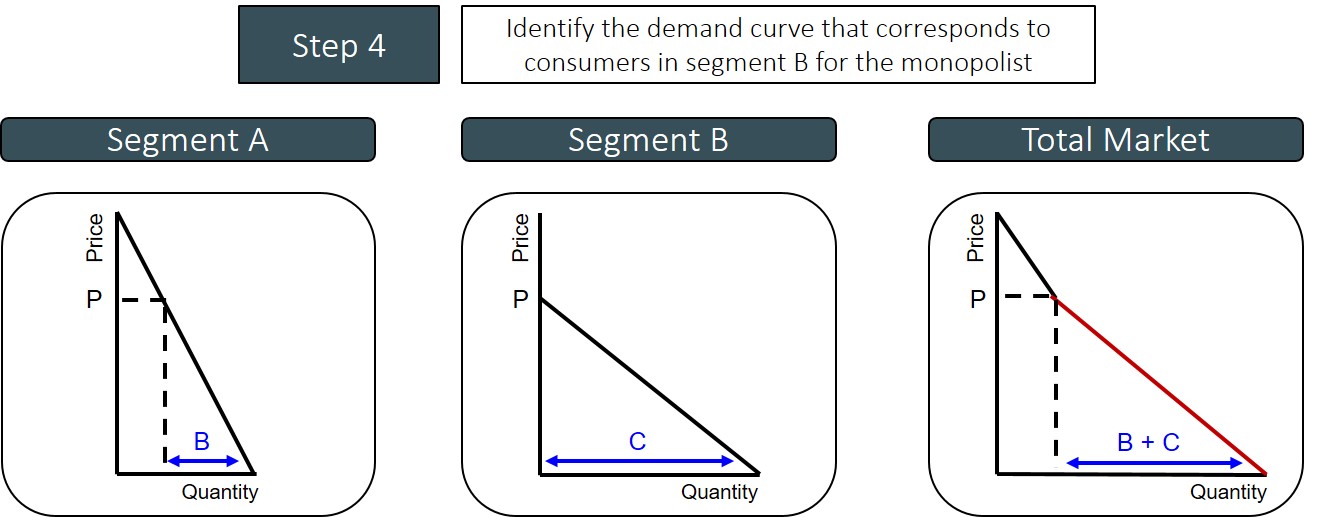
At prices below P, sales are made to both sub-markets (B represents the demand corresponding to Market A and C represents the demand corresponding to Market B). Therefore, the part of the demand curve for the monopolist below the price of P is formed by adding horizontally the two sub-market demand curves together below this price.

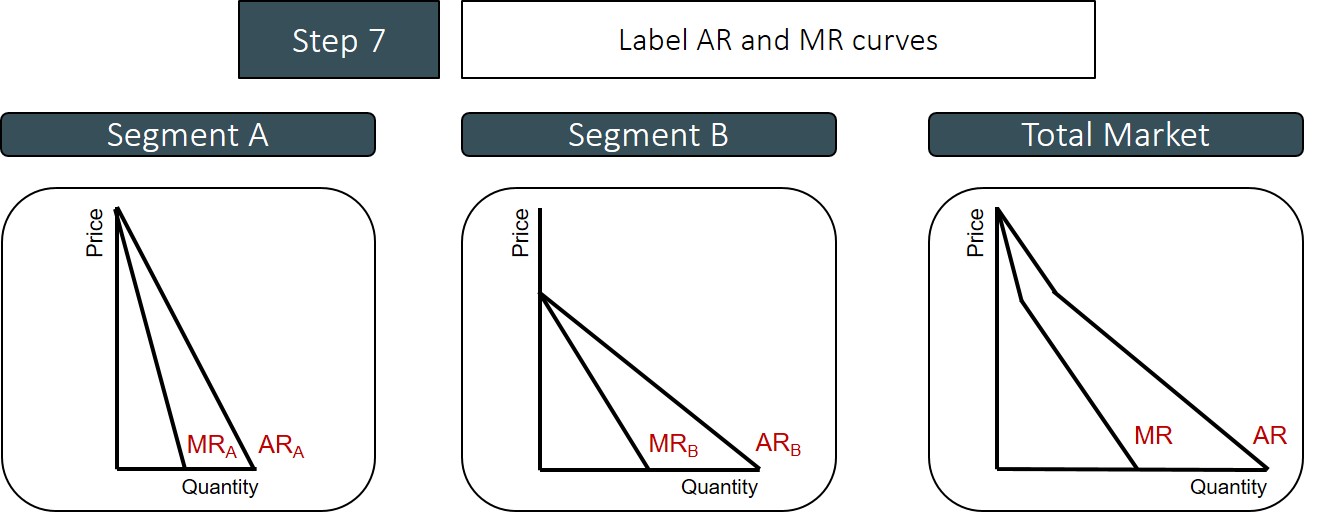
The Marginal Revenue curve is always twice as steep as the Average Revenue curve.
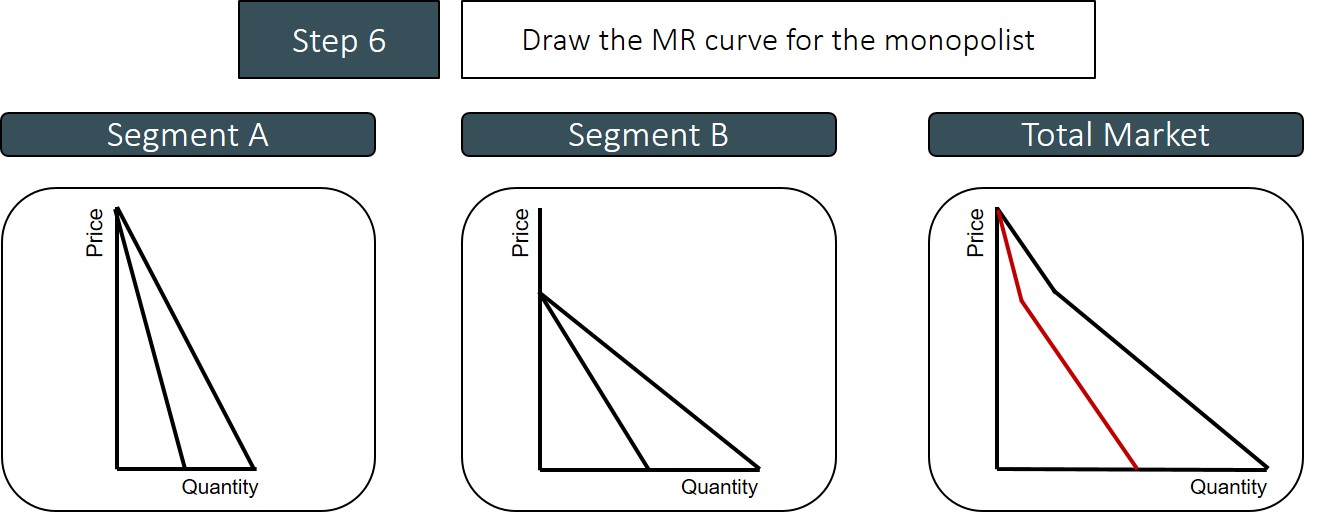
The MR curve for the monopolist is formed by combing the marginal revenue curves from both sub-markets, using the same logic of how the AR curves were formed. The MR curve for the monopolist is twice as steep as the relevant sections of the AR curve.
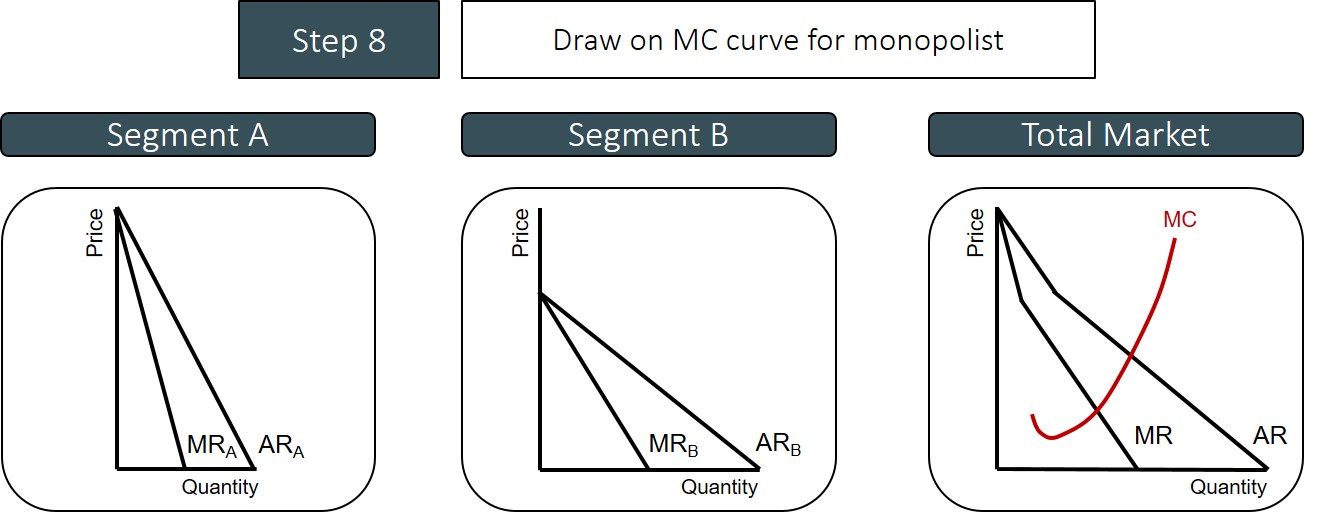
Marginal Cost curve for the monopolist takes the usual tick-shaped form.
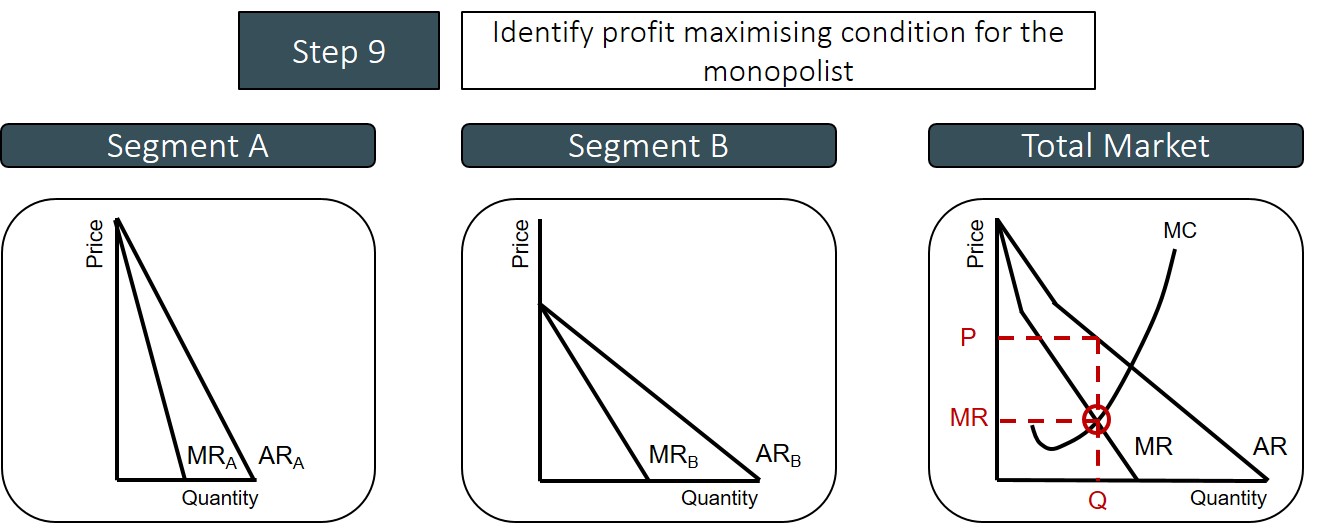
Monopolist profit maximises at the usual profit-maximising condition of MR=MC, but as a result of the market power it holds it can set a price up to the AR curve.
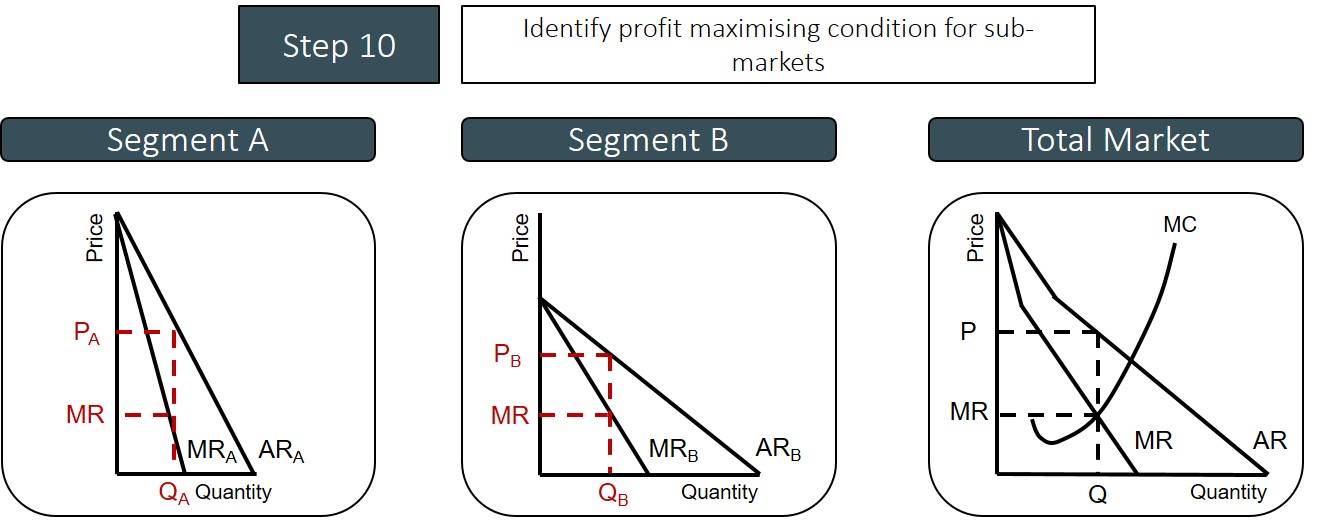
As the monopolist applies price discrimination to the two sub-markets the price of P is not set across the sub-markets. Instead they maximise profits by selling a higher quantity to market B and sell less to market A. To profit maximise across markets the condition that needs to be satisfied is that the MRA=MRB=MR across all markets. To achieve this the sub-markets needs to be charged different prices. Market A which has an inelastic demand curve, a higher price is charged because consumers are willing to buy the product at a higher price. However, market B has an elastic demand curve so a lower price to maximise the amount of revenue the monopolist can exploit from these reluctant consumers.
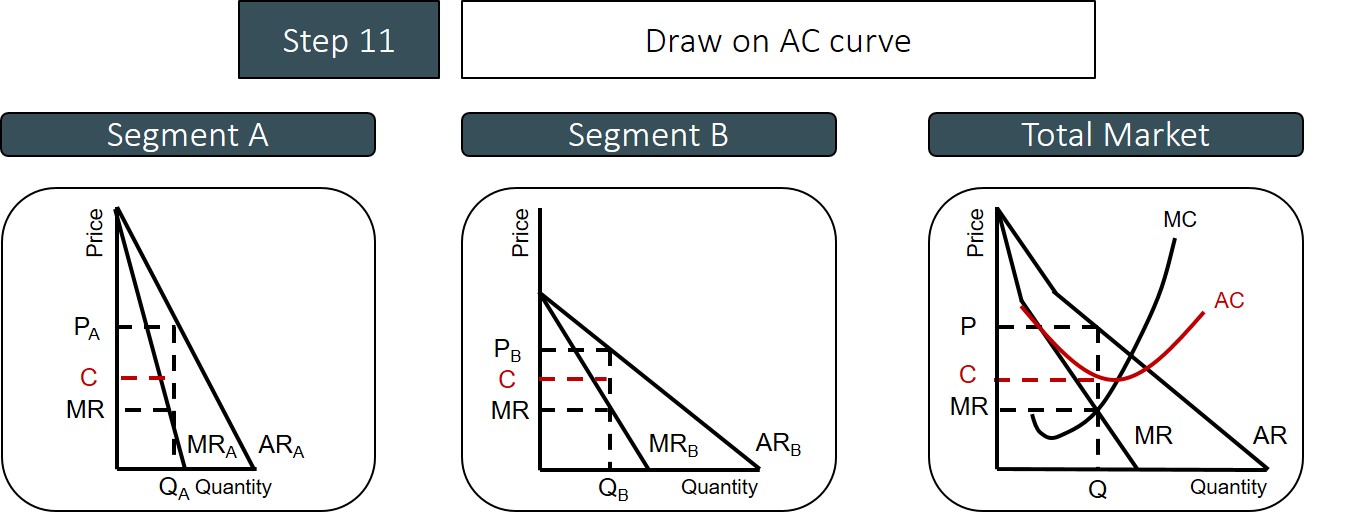
To identify the profits made by the monopolist via price discrimination the average cost curve needs to be drawn on for the monopolist.
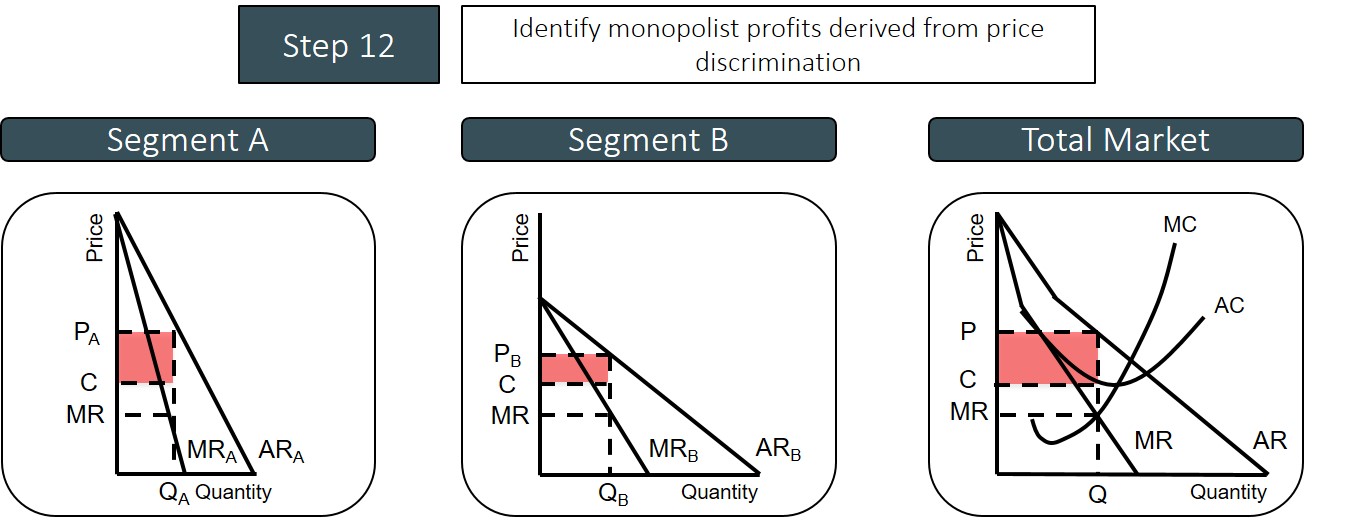
Supernormal profits represent difference between sales revenue and costs of production. This method of price discrimination brings the monopolist larger profits at the expense of consumer surplus.
Through the fact that the market becomes segmented, the pricing strategy increases total revenue when compared under a fixed pricing strategy and this increases the level of profit accruing to the monopolist as a result of an increase in sales. Also because of that fact that the firm has increased their scale of production it means it is likely to see a reduction in the firms costs as a result of a movement down the average cost curve, which can further increase profits in the long-run. However, whether the increased profits lead to better quality products and lower prices for consumers depends on the type of firm involved and whether they have the incentive to invest in R&D projects which can feed through to dynamic efficiency benefits. This may all depend on the type of industry at hand.
An evaluation point that could be mentioned when talking about price discrimination is the impact on consumers. This is because there are two types of consumers in the market and some will experience higher prices whilst others will experience lower prices and therefore the overall impact seen on consumers will all depend on the experience that consumers have in the market.
