The EzyEducation website uses cookies to help ensure we give you the best experience.
If you continue without changing your settings, we assume that you are happy to receive all cookies on the EzyEducation website.
Please refer to our Privacy and Cookies Statement to

find out more.

Continue

Economic Terms

0-9   A B C D E F G H I J K L M N O P Q R S T U V W X Y Z

Asset Transformation Function

The process in which banks convert large quantities of short-term, low risk, small and liquid deposits into a small number of much larger, long-term, riskier and illiquid advances (loans). This is how individual banks make majority of their profits by transforming assets to meet the incompatible needs and wants of borrowers and lenders simultaneously. 

The main risk with this type of approach for banks, is if a large long term loan is funded by a large number of small short term deposits, the bank may experience problems meeting the demands of depositors if large numbers decide to withdraw their deposit. In this situation the mismatch between the terms of depositors and borrowers is problematic as the loans may not be redeemable in the short term and this creates liquidity issues i.e. there may not be enough cash immediately available to allow depositors to withdraw their savings.

The diagram below illustrates how banks take cash from savers (surplus units - total income exceeds total expenditure) and the bank issues it off to borrowers (deficit units - total income exceeded by total expenditure) through loans in exchange for their debt (to be paid back at a later date).


Assets

An asset represents a valued economic resource belonging to an economic agent - in either tangible or intangible form - that adds to the wealth of an individual. 

Most commonly assets are a term commonly used when referring to financial institutions, as it appears on the balance sheets of these institutions.

For instance, the claims that banks have against economic agents represents what the bank owns on its balance sheet and therefore are marked down as part of their assets. For example a loan (advance) is an example of an asset that would appear on a bank's balance sheet as it is money that they have lent out to other parties but are expecting back into the bank in the future.


Assigned

When the rights under a contract (e.g. property deeds) are transferred to another party. Commonly used to provide security for a large loan or mortgage.

Austerity

Economic policy decisions that aim to restructure the economy so that is is possible to achieve economic growth as well as reduce the budget deficit and ultimately create a budget surplus so that national debts can be repaid. In order to achieve this the policies will involve increasing taxes (increased leakage) or reducing government spending (reduced injection).  The net result of this will be an inward shift in AD (AD1 to AD2 )and downward pressure on real national output (Y to Y1) and the price level (P to P1). 

If these policies contribute to a loss in confidence then it is likely that there will be a further fall in AD (AD2 to AD3). if the downturn is sustained in the long run some economists have argued that if the downturn is sustained over a long period tit will also lead to a damaging contraction in AS. 


It is important to understand that contraction is only part of the Austerity story. The point of experiencing the resulting contractionary effects of Austerity policies is that the negative short term impacts will be offset by a recovery in the medium and long term. This is expected to arise from avoiding any credit rating downgrades by being seen to proactively manage national debts, pursuing expansionary monetary policy and structuring the changes in taxes and spending to rebalance the economy so that the public sector contraction is covered by an expansion fo the private sector. 

Managing the cost of debt is critical in the UK due to the high levels of government, personal and corporate debt. Any reduction in the UK's credit rating will feed into financial markets and drive up the cost of borrowing.   

Needless to say this debate is heavily politicised and it is important that students are able to present a balanced view of this policy.


Automatic stabilisers

Automatic fiscal effects which help influence the path of economic growth due to cyclical changes in tax revenue and welfare costs. Often the presence of fiscal stabilisers reduces the effectiveness of a fiscal policy. 

For instance, if the government runs an expansionary fiscal policy, this should theoretically increase aggregate demand quite significantly as a result of the government spending component of AD increasing or higher consumption brought on by higher disposable income (Y-T). But taking into account the role of automatic fiscal stabilisers, the expansion in AD (upside in growth of output, employment and the price level) from this type of fiscal policy will be constrained and the aggregate demand curve shift may not be as significant i.e. shifts to ADrather than AD2.

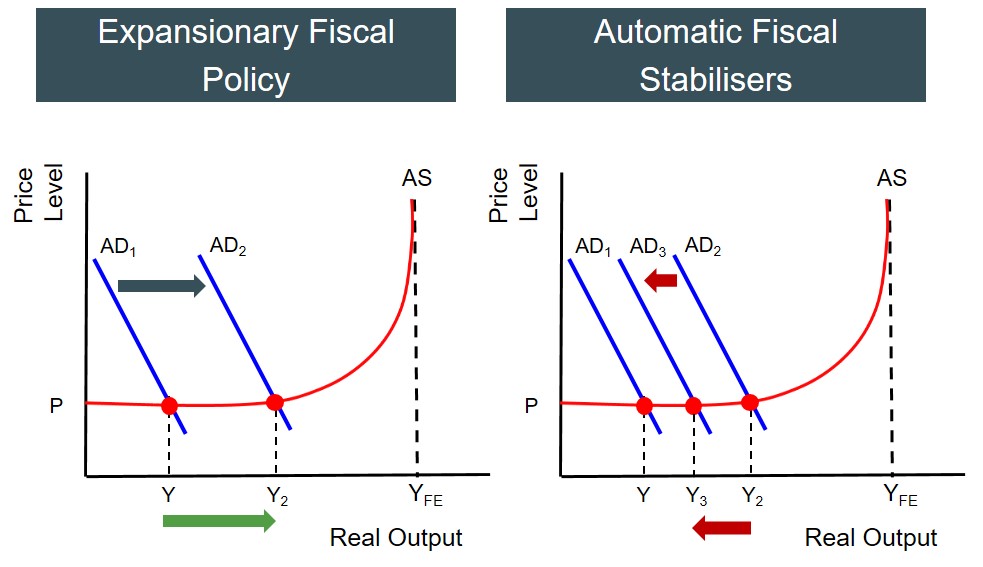
This happens because if real output increases, then this will lead to more people in employment and the individuals who were already in employment might secure higher wages. As a result the level of tax revenue the government now receives will be higher. At the same time the spending on welfare benefits will fall as more people enter employment. On a positive note this improves the financial position of the government (budget deficit could improve) but it also acts as a limit on the upturn seen in the economy.

It is also important to note that this significantly impacts the multiplier effect as well.  As the impact of a positive multiplier, in reaction to an expansionary fiscal policy, may well become diluted by the operation of automatic stabilisers. The greater the multiplier effect, the greater the restraint automatic stabilisers place on the upturn in the economy. 

On the other hand, if the government runs a contractionary fiscal policy, this should theoretically decrease aggregate demand quite significantly as a result of the government spending component of AD decreasing or lower consumption brought on by lower disposable income (Y-T). But taking into account the role of automatic fiscal stabilisers, the contraction in AD (downside in reduction of output, employment and the price level) from this type of fiscal policy will be constrained and the aggregate demand curve shift may not be as significant i.e. shifts to ADrather than AD2.

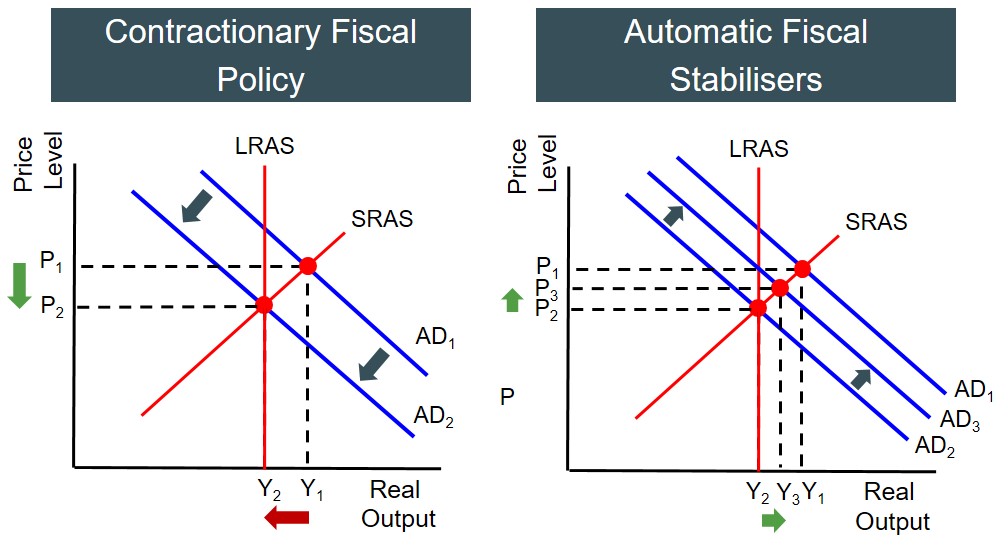
This happens because if real output decreases, then this will lead to fewer people in employment and the individuals who remain employed in employment might be on lower wages or have a general insecurity about their job safety. As a result the level of tax revenue the government now receives will be lower. At the same time the spending on welfare benefits will rise as more people become unemployed. From the government's perspective, this has a negative impact on their fiscal finances (the reduction n the budget deficit may not be as large as anticipated.) but it does act as a limit on the downturn seen in the economy.

It is also important to note that this significantly impacts the multiplier effect as well.  As the impact of a negative multiplier, in reaction to a contractionary fiscal policy, may well become diluted by the operation of automatic stabilisers. The greater the multiplier effect, the greater the restraint automatic stabilisers place on the downturn in the economy.


Availability Bias

Is a mental shortcut that relies on immediate examples that come to a given person's mind when evaluating a specific topic, concept, method or decision.

This is a cognitive bias as individuals tend to over-estimate the probability of an event occuring the more easily they can recall examples. For instance to put this bias to the test in an experimient individuals were asked to state which of the two options was more likely 'words beginning with k' or 'words where the third letter is k'. Most individuals wrongfully chose the former option as it is much easier to recall words that start with the letter k than it is with words where the thrid letter is k. Another example of this is to ask individuals to evaluate the probability of an airplane crash as the diagram below shows.


Average cost

The cost per unit of output. This is calculated by total cost divided by units of output. The table below shows the calculation of the average cost per unit for a firm for different levels of output and costs.


Average cost curve

A curve drawn to connect the average costs of production at every level of output. The curve will be U shaped and the lowest point will be the Pareto efficient point. This identifies the output producing the lowest average cost (productively efficient output).

Below is a diagram to illustrate the basic shape of the average cost curve. The section of the graph in which average costs are falling is when the firm is experiencing economies of scale and the red section of the graph is when the firm is experiencing diseconomies of scale. Therefore as the graph illustrates firms should be aiming to produce at the quantity that yields the minimum of this u-shaped curve i.e. producing too much leads to excess costs, inefficiency and diseconomies of scale.


Average costs

The cost per unit of output. This is calculated by total cost/units of output.


Average Fixed Cost (AFC)

Is the average fixed cost per unit of output produced.

Below is an illustrated example of how to calculate the AFC for different levels of output for a hypothetical firm. These points can then be used to map out the AFC curve for this firm.


Display # 
Forgot your password?