The EzyEducation website uses cookies to help ensure we give you the best experience.
If you continue without changing your settings, we assume that you are happy to receive all cookies on the EzyEducation website.
Please refer to our Privacy and Cookies Statement to

find out more.

Continue

Economic Terms

All   0-9   A B C D E F G H I J K L M N O P Q R S T U V W X Y Z

Effective supply

The quantity supplied at any particular price.

Elastic demand

When the percentage change in demand is greater than the percentage change in price. In this case the PED elasticity value will lie between 1 and infinity.

To identify the shape of an elastic linear demand curve we do not focus on the gradient of the curve as this does not actually determine elasticity. Crucially, it is the position of the demand curve that determines elasticity. This is because all linear demand curves contain portions on the curve which can be classed as elastic, inelastic and unit elastic. Any demand curve shown (like the one below) is just a section of a much larger demand curve that extends beyond the axis.

So effectively we can see that the midpoint of the demand curve is when unitary elasticity is achieved. The bottom half of the curve is inelastic, because if the price rises - at any point below the midpoint - expenditure increases despite a quantity fall. The top half of the curve is elastic, because if the prices rises - at any point above the midpoint - expenditure decreases due to a large quantity fall.

Therefore, the easiest way to determine an elastic demand curve is to extend the section of the demand curve drawn and identify which axis it intersects. If the demand curve intersects the y axis we can judge it as being an elastic demand curve as we must be focusing on the top half of the demand curve. An example of an elastic demand curve is shown below.

Below is a diagram to highlight the changes in expenditure that occurs when there is a small price rise. When a demand curve is relatively elastic, it means that consumers are sensitive to price changes. In this instance, a small price rise leads to a large fall in demand as consumers switch to alternative cheaper substitutes.


Elastic Supply

When the proportionate change in supply is greater than the proportionate change in price. In this case the PES value will be greater than 1.

Below is a diagram to show the characteristics of an elastic supply curve:

The supply curve has the typical upward sloping relationship between price and quantity supplied because of the greater profit incentives that are associated with higher prices. With an elastic supply curve firms have the ability to raise output quite significantly in response to a price rise and this is down to a few factors in the firms production process. 

These factors are:

1. Amount of Spare Capacity - The more spare capacity a firm has the greater their ability to raise output in line with prices. This is because they have the resources to do so given that they are producing below full capacity.

2. Length of Production Process - If a firm is producing a good which does not have a long production process they have the ability to respond to price changes by changing supply in line with short term price variations. 

3. Factor Substitutability - A firm will always wish to produce the good that has the highest price, as this is the good that will yield the highest level of profit. If firms are able to transfer their factors of production towards different production processes, they have the ability to increase output in line with prices.


Elasticity

A method for measuring the relationship between the value of 2 variables by dividing the proportionate change in the dependent variable (Q) by the proportionate change in the independent variable (P).

Elasticity of Demand

Is an elasticity measure that is used in economics to identify the responsiveness of quantity demanded to changes in price. These measures can become very useful evaluative tools when structuring an exam answer to a data response question. This is because the impact of demand and supply curve shifts on the market equilibrium will depend on the position and slope of these demand curves and that is determined by the elasticity values of the good.

When referring to elasticity measures that relate to demand, there are three that will aid the evaluation of an exam answer:

PED = Price Elasticity of Demand

YED = Income Elasticity of Demand

XED = Cross Elasticity of Demand 

Out of these elasticity measures PED provides the most intuitive analysis when evaluating the demand curve of a particular good.  Using PED as an elasticity measure we can define a good's demand as:

Inelastic Demand

Elastic Demand

Unitary Elastic Demand

Perfectly Inelastic Demand

Perfectly Elastic Demand

PED is a useful and effective concept when evaluating supply curve shifts, as the impact on the price and quantity demanded will depend on the elasticity of the demand curve for a good. For instance, if a demand curve is inelastic then when there is a supply curve shift it exacerbates the impact on price, but the impact on quantity is muted. This is because the inelastic demand curve relates to goods in which consumers are not price sensitive, despite the magnitude of the price change. This is often the case in markets which provide goods which are necessities to consume, such as agricultural products. Below is an example of how the elasticity of the demand curve in a market impacts changes in the market equilibrium:

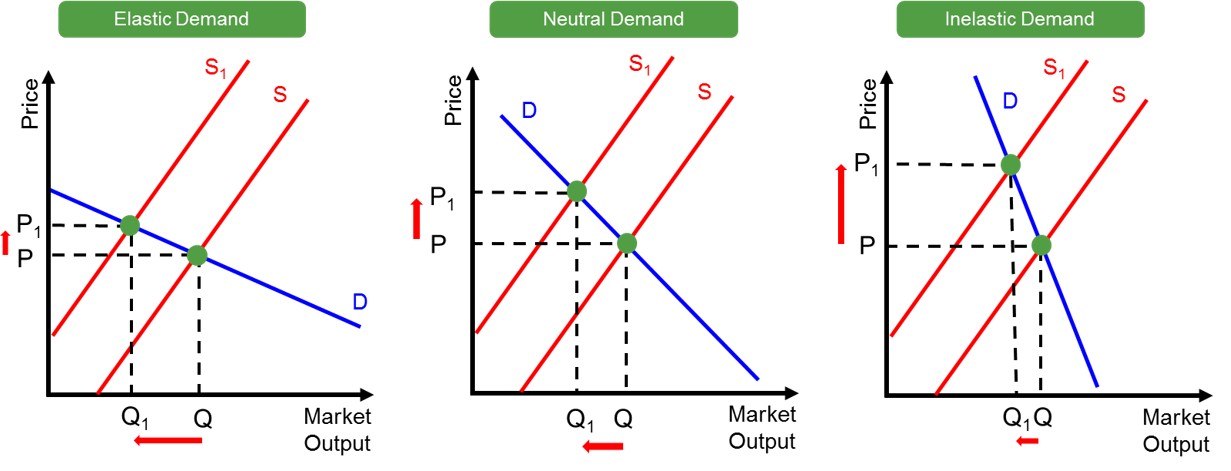
In this case, there is an inwards supply curve shift and this creates pressure for prices to increase to P1 as a result of excess demand. This is the case regardless of the elasticity of the demand curve. However, as is shown in the diagrams, the more inelastic the demand curve the greater the price increase in the market. The opposite process would occur if the supply curve would outwardly shift. 

This demonstrates that elasticity is a powerful evaluative tool when analysing changes in demand/supply curves and forms a crucial part in describing the chain of economic events that unfold in these types of markets.


Elasticity of supply

An elasticity measure to measure the responsiveness of the quantity supplied by firms to changes in prices. These measures can become very useful evaluative tools when structuring an exam answer. to a data response question. This is because the impact of demand and supply curve shifts on the market equilibrium will depend on the position and slope of the supply curves and that is determined by the elasticity values of the good. 

To measure the elasticity of supply curves we use the Price elasticity of supply measure, as this provides intuitive analysis when evaluating the supply curve of a particular good. Using PES as an elasticity measure we can define a goods supply as having:

Elastic Supply

Inelastic Supply

Unit Elastic Supply

Perfectly Elastic Supply

Perfectly Inelastic Supply 

PES is a particularly useful and effective concept when evaluating demand curve shifts, as the impact on price and quantity will depend on the elasticity of the supply curve for the good. For instance, if a supply curve is inelastic then when there is a demand curve shift it will exacerbate the impact on price, but the impact on quantity will be muted. This is because when firms face an inelastic supply curve they are unable to change supply in line with price changes in the traditional way. This may be down to a number of different factors which restrict firms ability to change output. Below is an example of how the elasticity of the supply curve impacts the changes in the economic variables following an inwards demand curve shift.

In this case, there is an inwards demand curve shift and this creates pressure for the price to fall to P1 as a result of excess supply. This is the case regardless of the elasticity of the supply curve. However, as is shown in the diagrams, the more inelastic the supply curve the greater the price fall in the market. The opposite process would occur if the demand curve outwardly shifts. 

So this demonstrates that elasticity is a powerful evaluative tool when analysing changes in demand/supply curves and forms a crucial part in describing the chain of economic events that unfold in these types of markets.


Elasticity values

Values which represent the degree of elasticity for a particular good.


Emission permit

Government issued permits authorising carbon emissions up to a certain level. They are often traded with efficient firms selling unused emissions to inefficient firms that need to exceed their emission permit to meet demand.

Empirical research

Research that informs theories by observing, measuring and analysing actual events.

Employment

When labour is engaged in the productive process in return for wages.

Display # 
Forgot your password?