The EzyEducation website uses cookies to help ensure we give you the best experience.
If you continue without changing your settings, we assume that you are happy to receive all cookies on the EzyEducation website.
Please refer to our Privacy and Cookies Statement to

find out more.

Continue

Economic Terms

0-9   A B C D E F G H I J K L M N O P Q R S T U V W X Y Z

Absolute Advantage

When a country experiences lower costs of producing a good than another country (i.e. produces more goods using the same resources).

Below is an example of how the absolute advantage between two countries works via a normal form matrix table. In this instance we have two countries and both produce two goods. Therefore the country that can produce the most units of each good given the same resources has the absolute advantage in the production of that good. 

Absolute advantage diagram

In this example, one country has an equal absolute advantage in both goods (France makes 3 for every item made by Poland). There is no incentive to specialise or trade. This is an unlikely theoretical outcome. it is more likely that countries will either enjoy a reciprocal absolute advantage or a comparative advantage.


Absolute Poverty

A general measure of poverty that classes an individual of living in poverty when they have insufficient income to afford the essentials of life.


Accelerator effect

Although the focus in this model is often the short term aggregate demand effects it is crucial to make the connection to productivity and aggregate supply. As investment will increase the use of capital in the productive process this has the potential to increase productivity, the productive capacity of the economy. This will help to shift LRAS and produce sustainable economic growth by increasing real output without inflationary consequences. 


Actual supply

The amount of a good actually supplied in a market. This may be different to planned supply due to production difficulties.

Ad valorem tax

A tax that is based on a percentage of the cost of a good or service e.g. 40% of the cost of goods and services sold.

The following table and diagram detail the impact of a 40% ad valorem tax and demonstrates how the imposition of the tax will lead to a rotational shift in the supply curve:


Adam Smith

A famous Scottish economist who authored the Wealth of Nations which, amongst other things, introduced concepts such as specialisation and the division of labour.


Adaptive Expectations

When economic agents form their inflation expectations on the basis that the future will be like the immediate past i.e. if the inflation rate was 2% last year it is likely to be close to 2% next year.

Below is a graphical representation of how adaptive expectations affect the economy. In this instance there is a positive aggregate demand shock that creates excess demand and introduces inflationary pressures into the economy. If workers in the economy hold adaptive expectations, they will expect that inflation rate to continue for the following years and therefore will demand higher wages to prevent a future fall in real income. The higher wages then push up production costs for firms and ultimately that forces producers to curb production, resulting in the inward shift of the SRAS curve.

The key concept to grasp is that adaptive expectations will mean you get a classic progression from A to B to C over a period of time. However, if agents possess rational expectations the change in prices will be anticipated and there will be a more immediate move from A to C without the emergence of a positive output gap.


Adverse selection

A form of asymmetric information in which one side of the market has more information regarding the transaction of a product than the other side of the market. creating a form of market failure. The most commonly used example of adverse selection is the market for second-hand cars, in which sellers have superior knowledge of the true quality of the car over the car buyers. Creating a market with only low-quality cars.

However, there are also instances in which the buyers can have more information than the sellers. For instance, in the insurance market, buyers of insurance have superior information about their true health characteristics and future behaviour patterns than the insurance provider. This leads to the risk that an insurance product is more likely to attract high-risk than low-risk customers e.g. unhealthy people are more likely to take out health insurance policies.

This form of asymmetric information can only be removed if there are appropriate screening (health checks on the buyer of health insurance) or signalling (warranties on the second-hand cars to verify their quality) policies in place to correct the market failure.


Agent

An individual that has the express or implied authority to act on the behalf of another individual (principal) to help establish contractual relationships with another party e.g. estate agent, financial adviser, estate agent etc.

A key related concept is the principal agent problem. This highlights the inefficiencies that can arise when the objectives of an agent and principal are misaligned. 


Aggregate demand

The total demand for goods and services at any given price level over a given period of time (AD = C + I + G + X - M).

C = Consumption

I = Investment

G = Government Spending

X = Exports

M = Imports

The actual level of AD is analysed using the aggregate demand curve and measured via the real GDP expenditure method. This graph details the outcome in 2012:


Aggregate demand curve

The curve that shows the total quantity of goods and services demanded (real output) at different price level (s).


Aggregate supply

The total supply of goods and services at any given price level over a given period of time.

This is usually measured using GDP using the output method. Value added is based on the value of final output in the economy less the cost of inputs used up in the production process. Final output represents the finished goods, excluding intermediate goods, which are inputs used in the production of finished goods or services.

If the final product is a car, the intermediate goods/inputs will be goods such as the car components, electricity and advertising purchased to produce the car. As the value of the final good (the car’s price) reflects both the value of its inputs (the tyres) and the engineering expertise of the manufacturer, adding the final output of the tyre manufacturer to final output of the car manufacturer together would overestimate GDP.

To avoid this double counting, the value added at each stage of production is calculated. These items are then aggregated to produce a figure for each production process and then the whole economy so that the figure reflects the gross value added (GVA) by all productive processes. This measure is referred to as GDP at market prices.

As the value of the final output includes the net effect of product taxes (product taxes less any subsidies provided) this value is calculated separately. If the net effect of product taxes is removed from the estimate of GDP it is referred to as GDP at basic cost. 


Aggregate supply curve

The curve that shows the total quantity of goods and services supplied at different price levels.

The diagram below shows the aggregate supply curve in its two time dimensions i.e. the short-run and long-run:

  • The SRAS curve captures the direct short-run relationship between real output and the price level.
  • The LRAS curve shows that in the long-run unless there is a change in the size or productivity of the factors of production employed, supply will always exist at the full employment level and will not vary with the price level, as the economy is at full capacity.

The diagram below illustrates the Keynesian AS curve. Unlike the classical view, the Keynesian view is based on a single AS curve with variable elasticity at different points to reflect the level of spare capacity in the economy at a particular point in time:

The Keynesian AS curve is perfectly elastic when there is substantial spare capacity but becomes progressively more inelastic as spare capacity diminishes. It is actually perfectly inelastic at the full employment level when there is no spare capacity remaining. The change in the elasticity of the AS curve means that the impact of AD shifts will result in differential outcomes for price level and real output. 

This has important implications for predicting the outcome of economic policies. This is a useful evaluative tool that can be used in exams as this curve shows that the significance of a change in AD depends on the level of spare capacity in the economy at a particular point in time. It also provides a nice contrast with the outcomes predicted under classical theory. 

The graphic below indicates the varying impact of an AD outwards curve shift would have on the price level and real output of the economy at a particular point in time depending on the segment of the Keynesian AS curve the economy is situated on. 


Allocating function of prices

As the price mechanism determines what consumers spend their money on it also determines how scarce resources are allocated (used). Prices have three seperate functions: rationing, signalling and incentive functions. These ensure collectively that resources are allocated correctly by co-ordinating the buying and selling decisions in the market.

Below is a diagram to illustrate how the price mechanism works in a supply and demand framework. In this instance, an increase in demand for a product forces producers to produce more of the product due to the higher profit incentives. This is because the excess demand (from a positive demand shift) forces the price up and therefore the producer knows that for selling each product they will receive a higher average level of revenue per unit. Therefore the higher demand is signalling to individuals to allocate more resources to producing this type of good.

So in summary prices serve to ration scarce resources particuarly when a disequilibrium exists. If there is excess demand, the price increases - forcing only the consumers who have the absolute desire and willingness to purchase the product. This often occurs for goods such as sporting tickets, where there is a limited supply but high demand.


Allocative efficiency

When resources are optimally distributed so that consumer surplus is maximised i.e. quantity demanded is equal to quantity supplied.

Below is a diagram to show the allocatively efficient point in a demand and supply context. At this point, resources are being distributed in the most efficient way and social welfare is maximised (producer surplus + consumer surplus). There is no other price that exists in which consumer surplus is maximised and no dead weight loss triangle is present at this point.

It is important to note that the position of the allocatively efficient point and whether it is achieved by the market will depend on the market structure that you are considering. For instance, in a monopoly market the allocatively efficient point will never be met as the firm has enough market power to extract as much profit from the consumers as possible - constraining consumer surplus and social welfare. 

Allocative efficiency can also be highlighted by using a PPF diagram but only if further information about consumer preferences and tastes is made available. This is because there are many points that lie on the frontier and only one of these points can be allocatively efficient, as only one production point will satisfy consumer's preferences and produce the optimal allocation of resources, despite all production points on the frontier being productively efficient. 


Allocatively inefficient

Where resources in the economy are not distributed optimally and therefore consumers cannot purchase the quantity of goods that they desire. This occurs when the price is not equal to the marginal cost for firms and also the economy is operating on a point that does not lie on the PPF.

The diagrams below illustrate how graphically allocative inefficiency can be illustrated for firms and the economy as a whole. For firms, if they are producing at the point where price is not equal to the marginal cost, they are producing a sub-optimal amount of resources for consumers, the market shown below is a monopoly market, as this is a market with a high level of inefficiencies due to monopoly power.

The diagram on the right illustrates that when an economy is not producing on its PPF it is not using all the resources in the economy to produce a share of goods for economic agents to consume. Any point not on the PPF corresponds to an allocatively inefficient point.


Altruism

The disinterested and selfless concern for the well-being of others.


Anchoring Bias

Is a cognitive bias that describes the common human tendency to rely too heavily on the first piece of information offered (the "anchor") when making decisions. During decision making, anchoring occurs when individuals use an initial piece of information to make subsequent judgments.

For instance if individuals were asked whether the tallest building in the world was more or less than X amounts of ft, the mean answer given would be influenced by the x value given to them. As individuals use that information to sway their guess.


Appreciating exchange rate

A rise in the value of a currency due to excess demand for the currency. This will result in higher export prices and lower import prices.

In this example an increase in exports has increased the demand for the currency from D to D1. Without any change in supply to accommodate this demand this means the excess demand increases the exchange rate (the price of the currency) fro P to P1. At a price of P1 the exchange rate has appreciated and the movement up the supply curve means that the equilibrium is re-established as D1 = S.

Foreign currency is possibly the best example of how the forces of demand and supply operate, as vast amounts of currnecy are traded around the clock. Market makers will continuously adjust currency rates (the price of a currency) to clear the market by balancing prospective buyers and sellers. If there are more prospective buyers than sellers this means the price is too low and market makers will respond by gradually raising the price. The respective laws of demand and supply means that this price rise will disincentivise demand and incentivise supply until the market finally clears when the price reaches the point where demand equals supply. This is how exchange rates appreciate. 

An appreciation in exchange rate can be caused by:

  • An increase in demand - because foreign countries require sterling because they wish to acquire UK goods and services or they wish to move their savings to the UK.
  • A reduction in supply - because UK firms and individuals supply sterling to acquire foreign currency so they can purchase imports or to move their savings to other countries. 


Arbitrage

Making a profit by identifying opportunities to buy an asset in one market and to sell it on in another market at a higher price. The flowchart below illustrates the process of arbitrage for an investor to make an instant risk-less profit. Profit can be achieved without risk because the price differences occur at the same point in time which means that the respective trades can occur at the same time to exploit the price differential and make a profit.

The price differentials normally occur due to technical reasons e.g. a financial asset is traded in two locations (e.g. London and New York) and a temporary and unintended price differential emerges. These differentials are usually correctly quickly and so arbitrage opportunities must be identified and exploited quickly. Various software applications support this process. Although the price differentials are small and apparently trivia, large levels of profit can be made by applying large sums of money to exploit a small price differential.


Asset Transformation Function

The process in which banks convert large quantities of short-term, low risk, small and liquid deposits into a small number of much larger, long-term, riskier and illiquid advances (loans). This is how individual banks make majority of their profits by transforming assets to meet the incompatible needs and wants of borrowers and lenders simultaneously. 

The main risk with this type of approach for banks, is if a large long term loan is funded by a large number of small short term deposits, the bank may experience problems meeting the demands of depositors if large numbers decide to withdraw their deposit. In this situation the mismatch between the terms of depositors and borrowers is problematic as the loans may not be redeemable in the short term and this creates liquidity issues i.e. there may not be enough cash immediately available to allow depositors to withdraw their savings.

The diagram below illustrates how banks take cash from savers (surplus units - total income exceeds total expenditure) and the bank issues it off to borrowers (deficit units - total income exceeded by total expenditure) through loans in exchange for their debt (to be paid back at a later date).


Assets

An asset represents a valued economic resource belonging to an economic agent - in either tangible or intangible form - that adds to the wealth of an individual. 

Most commonly assets are a term commonly used when referring to financial institutions, as it appears on the balance sheets of these institutions.

For instance, the claims that banks have against economic agents represents what the bank owns on its balance sheet and therefore are marked down as part of their assets. For example a loan (advance) is an example of an asset that would appear on a bank's balance sheet as it is money that they have lent out to other parties but are expecting back into the bank in the future.


Assigned

When the rights under a contract (e.g. property deeds) are transferred to another party. Commonly used to provide security for a large loan or mortgage.

Austerity

Economic policy decisions that aim to restructure the economy so that is is possible to achieve economic growth as well as reduce the budget deficit and ultimately create a budget surplus so that national debts can be repaid. In order to achieve this the policies will involve increasing taxes (increased leakage) or reducing government spending (reduced injection).  The net result of this will be an inward shift in AD (AD1 to AD2 )and downward pressure on real national output (Y to Y1) and the price level (P to P1). 

If these policies contribute to a loss in confidence then it is likely that there will be a further fall in AD (AD2 to AD3). if the downturn is sustained in the long run some economists have argued that if the downturn is sustained over a long period tit will also lead to a damaging contraction in AS. 


It is important to understand that contraction is only part of the Austerity story. The point of experiencing the resulting contractionary effects of Austerity policies is that the negative short term impacts will be offset by a recovery in the medium and long term. This is expected to arise from avoiding any credit rating downgrades by being seen to proactively manage national debts, pursuing expansionary monetary policy and structuring the changes in taxes and spending to rebalance the economy so that the public sector contraction is covered by an expansion fo the private sector. 

Managing the cost of debt is critical in the UK due to the high levels of government, personal and corporate debt. Any reduction in the UK's credit rating will feed into financial markets and drive up the cost of borrowing.   

Needless to say this debate is heavily politicised and it is important that students are able to present a balanced view of this policy.


Automatic stabilisers

Automatic fiscal effects which help influence the path of economic growth due to cyclical changes in tax revenue and welfare costs. Often the presence of fiscal stabilisers reduces the effectiveness of a fiscal policy. 

For instance, if the government runs an expansionary fiscal policy, this should theoretically increase aggregate demand quite significantly as a result of the government spending component of AD increasing or higher consumption brought on by higher disposable income (Y-T). But taking into account the role of automatic fiscal stabilisers, the expansion in AD (upside in growth of output, employment and the price level) from this type of fiscal policy will be constrained and the aggregate demand curve shift may not be as significant i.e. shifts to ADrather than AD2.

This happens because if real output increases, then this will lead to more people in employment and the individuals who were already in employment might secure higher wages. As a result the level of tax revenue the government now receives will be higher. At the same time the spending on welfare benefits will fall as more people enter employment. On a positive note this improves the financial position of the government (budget deficit could improve) but it also acts as a limit on the upturn seen in the economy.

It is also important to note that this significantly impacts the multiplier effect as well.  As the impact of a positive multiplier, in reaction to an expansionary fiscal policy, may well become diluted by the operation of automatic stabilisers. The greater the multiplier effect, the greater the restraint automatic stabilisers place on the upturn in the economy. 

On the other hand, if the government runs a contractionary fiscal policy, this should theoretically decrease aggregate demand quite significantly as a result of the government spending component of AD decreasing or lower consumption brought on by lower disposable income (Y-T). But taking into account the role of automatic fiscal stabilisers, the contraction in AD (downside in reduction of output, employment and the price level) from this type of fiscal policy will be constrained and the aggregate demand curve shift may not be as significant i.e. shifts to ADrather than AD2.

This happens because if real output decreases, then this will lead to fewer people in employment and the individuals who remain employed in employment might be on lower wages or have a general insecurity about their job safety. As a result the level of tax revenue the government now receives will be lower. At the same time the spending on welfare benefits will rise as more people become unemployed. From the government's perspective, this has a negative impact on their fiscal finances (the reduction n the budget deficit may not be as large as anticipated.) but it does act as a limit on the downturn seen in the economy.

It is also important to note that this significantly impacts the multiplier effect as well.  As the impact of a negative multiplier, in reaction to a contractionary fiscal policy, may well become diluted by the operation of automatic stabilisers. The greater the multiplier effect, the greater the restraint automatic stabilisers place on the downturn in the economy.


Availability Bias

Is a mental shortcut that relies on immediate examples that come to a given person's mind when evaluating a specific topic, concept, method or decision.

This is a cognitive bias as individuals tend to over-estimate the probability of an event occuring the more easily they can recall examples. For instance to put this bias to the test in an experimient individuals were asked to state which of the two options was more likely 'words beginning with k' or 'words where the third letter is k'. Most individuals wrongfully chose the former option as it is much easier to recall words that start with the letter k than it is with words where the thrid letter is k. Another example of this is to ask individuals to evaluate the probability of an airplane crash as the diagram below shows.


Average cost

The cost per unit of output. This is calculated by total cost divided by units of output. The table below shows the calculation of the average cost per unit for a firm for different levels of output and costs.


Average cost curve

A curve drawn to connect the average costs of production at every level of output. The curve will be U shaped and the lowest point will be the Pareto efficient point. This identifies the output producing the lowest average cost (productively efficient output).

Below is a diagram to illustrate the basic shape of the average cost curve. The section of the graph in which average costs are falling is when the firm is experiencing economies of scale and the red section of the graph is when the firm is experiencing diseconomies of scale. Therefore as the graph illustrates firms should be aiming to produce at the quantity that yields the minimum of this u-shaped curve i.e. producing too much leads to excess costs, inefficiency and diseconomies of scale.


Average costs

The cost per unit of output. This is calculated by total cost/units of output.


Average Fixed Cost (AFC)

Is the average fixed cost per unit of output produced.

Below is an illustrated example of how to calculate the AFC for different levels of output for a hypothetical firm. These points can then be used to map out the AFC curve for this firm.


Average propensity to consume

The proportion of income that consumers are likely to spend.

Average propensity to save

The proportion of income that consumers are likely to save.

Average Variable Costs (AVC)

The average variable cost per unit of output produced.

Below is an illustrated example of how to calculate the AVC for different levels of output for a hypothetical firm. These points can then be used to map out the AVC curve for this firm.


Bad Good

Is a good that when consumed yields disutility i.e consumption is unpleasant or does not lead to satisfaction or positive utility. For example if a consumer consumed expired food that makes you ill, this would be an example of a bad good as after consumption the consumer will have less utility than before. In effect these goods ar just opposites of a normal good.

However, there is some subjective judgement over whether a good is beneficial to consume or in fact it leads to reduced utility. For instance, even though the health effects of smoking can make smoking a bad, smokers believe they enjoy smoking which make it a good at the time of consumption.


Balance of payments account

A financial document that measures a country’s economic activities with all other countries over a period of time. These documents are made up of two different accounts: Current Account and Financial Account.

The current account is a main measure of trade of goods and services between other countries and therefore is a sign of the relative competitiveness of a country to the rest of the world. The financial account is a measure of financial flows between countries such as trades of financial assets. These documents must balance and therefore if a country is running a large deficit on one of the accounts then they must have a similarly large surplus on the other account to make the balance of payments 'balance'.

The diagram below shows the UK's balance of payments position from the years 1946-2010. The most striking image from this diagram is that the UK have been continuing to finance a growing current account deficit with a growing financial account surplus i.e. selling financial assets to borrow money to finance the deficit on goods and services to live beyond ther means. 


Balance of trade in goods

The value of goods exported minus the value of goods imported.

Balance of trade in services

The value of services exported minus the value of services imported.

Balance Sheet

A financial account that reports a company's assets, liabilities and net worth position of a bank. This account provides a neat summary of the bank's performance levels over a given financial year for shareholders and investors alike.

Below is an example of some of the typical instruments that would appear on both sides of the balance sheet for a financial institution.


Balanced budget

When the amount of tax revenue forecast in the Government’s budget is equal to the cost of all planned expenditure.


Bank Failure

Occurs when a bank becomes technically insolvent (liabilities > assets) and all of the equity capital for the bank has been exhausted i.e. it no longer has any equity capital to act as a buffer stock and absorb losses that the bank makes.  

The process of a bank failure is as follows: The bank's assets fall in value on the balance sheet because of non-performing loans (NPLs) and this makes the bank a loss which the equity capital must cover, but as the equity capital shrinks the bank becomes more vulnerable on its balance sheet. Eventually (if these loses continue) they will become insolvent when the losses they have made on assets exceed the level of equity capital.


Bank of England

The UK’s central bank. Responsible for maintaining a stable banking system by:

  1. Managing the currency, money supply and interest rates.
  2. Supervising commercial banks.
  3. Providing liquidity in times of crisis (lender of last resort).

The Governor of the Bank of England is Mark Carney. He is a Canadian banker and chairs the Monetary Policy Committee which manages monetary policy on behalf of the Government.


Bank rate

The rate of interest at which the Bank of England charges banks for secured overnight lending (secured by gilt holdings). Banks can borrow from the Bank of England when they have an urgent need for finance because they are not able to borrow money at viable rates from other sources. This rate is also known as the Repo Rate

In theory there should be a correlation between the bank rate and other interest related variables such as the rate at which commercial banks decide to lend to businesses and consumers at. The idea is that if the bank rate falls it should create cheaper and easier credit for borrowers across the economy. The diagram below summarises the influence that changes in the bank rate have on the rest of the economy over time. 


Bank Run

When depositors have a rational marginal propensity to withdraw their money earlier than they would optimally like to do so. This is caused because of the fear that if a bank goes bankrupt the deposit they had placed in the bank will also disappear. Bank runs are prompted via a bad performance from the bank announced publically and thus prompting depositors to fear their deposit is no longer safe.


Banking Crisis

When confidence in the banking system is undermined because many banks have experienced liquidity problems, leaving them in a position where they are unable to borrow money. When this happens it will have hugely negative consequences for the economy. This is because a crisis will mean banks reduce lending so that the availability of credit  in the economy reduces and this has negative impacts on private investment and consumption. If a crisis persuades international investors to repatriate capital, a crisis could also lead to a damaging devaluation in the exchange rate of the host currency.   

The nature of a banking crisis means that problems can start with small number of banks and spread through the whole financial system. This is why struggling banks often receive a bailout from the government to prevent systemic problems in the wider economy.


Bankruptcy

A legal status that defines a person or institution unable to repay any outstanding debts owed to creditors.

In a banking sense this is when the banks equity capital has become exhausted and as a result they no longer have any funds available to recover losses made on their balance sheet - prompting a bank failure.

Bankruptcy most commonly occurs when the bank's assets fall in value on the balance sheet because of the presence of non-performing loans (NPLs) and this makes the bank a loss which the equity capital must cover. But the more equity capital is used up, the more vulnerable the bank becomes. Eventually (if these losses continue) the bank will run out of equity capital and it will become technically insolvent when the losses they have made on assets exceed the level of equity capital.


Bargaining Power

Bargaining power is the relative ability of parties in a situation to exert influence over each other. This is commonly seen in monopoly or monopsony market structures.


Barriers to entry

Factors that increase the difficulty at which new firms can enter into a market. In some cases this can prevent new firms from entering - making the market less contestable.

There are two different types of barriers to entry which can prevent new firms from entering and increasing competition.

Artificial barriers are barriers that have been set up by the incumbent firms already established in the market to ensure their market share and profits do not slip.

Natural barriers are barriers which exist because of the structure of the market or the resources available to firms in this specific market. There types of barriers normally prevent firms from entering costlessly.


Barriers to exit

Factors that can prevent existing firms from exiting a market e.g. long term contracts and property leases. The presence of significant barriers to exit leave a market uncontestable as it makes hit-and-run entry more difficult to undertake as a strategy, from a new entrant's perspective. This is because firms can no longer exit costlessly.


Barter

The process of trading goods and services without the exchange of money.

The diagram below illustrates the process of barter between a farmer and a builder. As long as a double coincidence of wants is present between the two economic agents then they can engage in a mutually beneficial cashless exchange of goods.

This was the main form of exchange before a monetary system was introduced in all modern economies. Barter was eventually phased out as it became inefficient due to the variety of goods available increasing as a result of specialisation in the production process.


BASLE

The first capital accord introduced by the Basle Committee in 1988, to ensure that capital requirements across most developed countries were standardised and uniform i.e. all banks had to back their assets with the same percentage of capital when adjusted for risk.

This capital accord used a risk-weighted system where each class of asset would have a risk-weight attached to it so banks could calculate how much capital it was legally required to hold. Bank's were advised to hold at least 8% of their asset value in the form of capital - of which at least 50% of that must be held in Tier 1 capital.

However this accord eventually broke down when the system was attacked for not being operationally robust enough and therefore not punishing banks who held riskier loans compared to those with safe loans. BASLE II has since replaced this capital accord. 


Basle Committee

Is a committee of banking supervisory authorities with the goal to enhance understanding of key supervisory issues and improve the quality of banking supervision worldwide. Through this committee the capital adequacy requirements known as BASLE were introduced to ensure a uniformity across all banks in terms of the capital backing which was required, in light of the globalised financial world now in place.


BASLE II

The second capital accord to be introduced by the Basle Committee to correct and ensure that the capital adequacy requirements for banks was financially and robust enough. This was proposed in 2004 and was implemented fully by 2008 and the main difference was it ensured that banks had a higher capital charge imposed on them if they prescirbed a loan to a small company compared to a large company like Apple. This will be replaced by BASLE III in 2023.


BASLE III

Is the third capital accord to be introduced by the Basle Committee in 2013 and will be fully phased in by 2023. This once agin built on the foundations of BASLE II and will impose tougher capital and leverage restrictions on banks, raising the level of Tier 1 capital a bank should hold to 13.5%


Benefits

The utility or pleasure that individuals experience by consuming a good or service.


Billion

1,000 x 1m

Black market

A secondary market where cash transactions take place "off the books" to side step price controls and excessive indirect taxes or to supply goods that are prohibited. A black market may also emerge where supply is deficient and consumers that acquire the goods are encouraged to re-sell the goods at a far higher price.


Bond

A bond is a contract the facilitates a large loan. It will set out the terms of the loan including the interest rate (coupon), repayment date (redemption) Corporate bonds relate to loans made to businesses while government bonds relate to loans made to governments.  

Wealthy individuals can invest in bonds to directly lend money to governments and big businesses. Individuals that have saved money will usually pool their savings in investment or pension funds that then invest in corporate or government bonds. The total value of debt in UK corporate and government bonds is enormous exceeds £2 trillion i.e. 2m x £1m.

Bonds are usually used to borrow very large amounts of money when it is more convenient and cost effective for an organisation to borrow from the market as a whole rather than from individual banks.


Bond par value

Also known as the principal. Is the amount of money that a bondholder will receive once a bond reaches its maturity date.


Bond Yield

The yield on a bond is the annual coupon payment expressed as a percentage of the market price of the bond.

It illustrates the percentage of the coupon payment the investor is being rewarded with relative to the value of the bond. Higher bond yields illustrate that the investor will receive a large fraction of the value of their bond realtively early on. Bond yields have an inverse relationship with the market price of the bond as well as interest rates and can be calculated using the formula below:


Boom

A period of economic activity characterised by an increase in the rate of real output growth and increasing inflation.

As the diagram below illustrates this rise in economic activity will eventually lead to output being pushed above the full employment level, which is unsustainable. Therefore this is what causes inflationary pressures to be introduced to reign in the boom.


Boom/Bust policy

When the Government implements policies that fail to maintain steady growth and instead it achieves periods of rapid growth (boom) followed by decline (bust).

In normal cycles of economic activity an upturn leads to a boom followed by a downturn in which a recession leads to a trough which indicates the economy has gone bust. This description is used because low levels of economic growth will usually mean that tax revenues fall, government spending rises and the government is forced to borrow money to cover the shortfall in its finances. In extreme cases a sustained downturn may mean that a government is not able to borrow money from financial markets and will need to seek a bailout from organisations such as the IMF.

Although the real economy's economic cycle does not operate as smoothly as depicted in the graph, the general pattern seen is similar. The depth and duration of the different cycle phases will largely depend on the effectiveness of fiscal and monetary policies implemented by the government and central bank. Government's are not always prepared to pursue the fiscal and monetary policy that is necessary to control economic cycles. This is often the cause of extreme and prolonged downturns and the need to obtain bailout funding.


Bottleneck

When supply in a particular part of the economy is insufficient and this holds back growth in other parts of the economy.

Bounded Rationality

Is the idea that when individuals make decisions, their rationality is limited by the information they have, the cognitive limitations of their minds, and the time available to make the decision.


Bounded Self-Control

To question the idea that individuals are able to exercise self-control when presented with certain choices.

Below is an example of how this behavioural economics theory comes about. In this instancet Jenny has slipped out of her weekly regime for going to the gym and we have to assess whether she has chosen to stop this regime herself or whether it is a lack of self-control and discipline to keep the regime going.


Branded good

A way of differentiating a good through the use of a wide range of promotional techniques.


Branded goods

A way of differentiating a good through the use of a wide range of promotional techniques.

Broad money

A measure of the money supply that includes money held on deposit at banks in easily accessible accounts in addition to the physical notes and coins in circulation. M4 is the core measure of Broad Money and amounted to circa £2 trillion in 2013.

Budget deficit

When the expenditure made by a government exceeds the taxes raised over a given period.


Budget surplus

When the expenditure made by a government is less than the taxes raised over a given period. This is an essential condition to enable repayment of national debt.


Buffer stock scheme

A scheme established and funded by the Government to control prices in key markets (e.g. soft commodities). The scheme works by actively buying and selling the goods produced in the market, so that market prices are stabilised.

This policy is used in markets that suffer from volatile prices. Therefore, it is a commonly used policy in agricultural markets as these markets are subject to large seasonal fluctuations involved in producing the agricultural products, which readily impact supply and demand and ultimately cause the prices to fluctuate. When prices for agricultural products fluctuate, then so do the incomes of the farmers harvesting these products. This can have wider implications for the economy because if farmers income progressively deteriorates, then it could lead to investment in capital in the agricultural market to fall and ultimately this will reduce crop yields, as well as productivity and efficiency in this market. This is a particular problem for developing countries, as their economies rely heavily on the success of agricultural exports.  

A buffer stock is a cyclical scheme in which surplus stock is effectively recycled to the consumers to prevent the waste of resources. The cycle starts when farmers have a good harvest (e.g. down to favourable weather) and this leads to supply being higher than anticipated and the supply curve outwardly shifts to S1. Assuming ceteris paribus, this creates excess supply in the market, creating downward pressure on the price of crops to change to P1. So to prevent the price from falling, the government intervenes and buys up the surplus of (QS - Q*) at the original higher price, shifting the demand curve to D2, protecting farmers margins and income in the process. 

The next phase is the decision of what the government decide to do with the excess stock they have now acquired from the farmers. Now in this instance agricultural products are perishable (quality diminishes very quickly) goods and therefore the government cannot hold this stock for a long period of time, as the product will be worthless to any consumer. At the same time they do not want to dispose of the surplus stock as that would be a waste of the economy's resources. Therefore, they are required to keep this surplus in storage. But by doing so can create the government a whole lot of problems, as storing resources is a very expensive process and involves a high opportunity cost. Also, placing surplus stock into storage is subject to spatial and technical requirements, as some goods require to be stored in a technical way such as refrigerating certain agricultural products. Particularly for developing countries, they may not have the capital and technology to store these goods effectively.

If the government has the capability to store the surplus stocks effectively then this stock gets resold to the farmers during a bad harvest when supply is short and the supply curve shifts to S2. This is because without farmers being resold the surplus stock there would be excess demand in the market equal to (Q* - QS) and this creates upward pressure on prices to change to P2. The extra stock sold to farmers shifts the supply curve back to its original position (S1) and restores stability to the price of this product. The severity of the bad harvest depends on how much stock the government decides to sell back. 

However, one of the main issues with a buffer stock scheme is that often there are consecutively bad harvests for farmers to cope with, which means the scheme breaks down as a result of the government's surplus stock becoming exhausted. If this happens, it returns the market to a situation of volatile prices and incomes.

Another issue with this policy is it can create moral hazard problems with farmers and as a result reduces the efficiency of the market. For instance, if farmers know that whenever prices fluctuate the government will intervene to stabilise them, then there is no incentive from the farmers perspective to become more efficient and invest and innovate into the production process of the products.  Therefore, the policy has effectively encouraged inefficiency by a offering a guaranteed price to farmers under all circumstances. 


Business taxes

These are taxes imposed on businesses such as corporation tax (on profits) and VAT (on sales).

Bust

A period of economic activity characterised by sharp contractions in real output due to policy initiatives designed to correct high rates of inflation.

A bust is often characterised by output and employment falling below the full employment level and as a result creating a negative output gap. As well as introducing a possible deflationary spiral if demand contracts too severely. Below is a diagram to illustrate the AD-SRAS framework for an economy suffering a bust.


CAP

The Common Agricultural Policy is a system of subsidies and programmes to encourage and control the supply of agricultural products within the EU.

It works by guaranteeing farmers a given price for their agricutltural products and therefore removes any uncertainty around and instability around crop prices. It would work in the same way as a buffer stcok scheme should work. The EU would buy goods from EU farmers at the high price if their was oversupply in the market. The amount they would buy wold be equal to (Qs-Qd). This price was often far higher than the market price so that it could supplement farmer's incomes during uncertain times. However it did incentivise farmers to over-produce to receive a higher income from the EU government and therefore was very inefficient. The process of the CAP is shown below in the diagram.


Capital

The factor of production that is used to produce goods and services. Capital can be either fixed capital e.g. offices, factories, machines, tools, vehicles and transport links or working capital e.g. raw materials and components. The reward for the use of capital is interest.


Capital account

Records all the flows of capital arising from investment and currency transactions - Foreign Direct Investment (more than 10% of the share value of a company acquired), Portfolio Investments (less than 10% of the share value of a company acquired), trade credit, loans, currency trading and bank deposit movements.


Capital Adequacy Ratio

This ratio is used to protect depositors and promote the stability and efficiency in financial markets. The amount due to be held by banks depends on the risk profile of their assets i.e. the riskier the assets the larger the capital charge attatched to it.


Capital Adequacy Requirements

These are the requirements implaced on banks for the minimum amount of capital they have to hold against the value of their assets to act as a buffer stock towards losses that could threaten the solvency of an individual bank and the systemic stability of an entire industry. Since 1988 the Basle Committee has set these and has called them BASLE, with additional follow-ups to improve these requirements called BASLE II and BASLE III.


Capital deepening

Is when capital levels increase at a faster rate than labour inputs i.e. total capital and capital per worker increases.

Capital gain

The difference between the acquisition and sale price of capital. This is mostly associated with investments in assets e.g. property, shares and other financial assets.

Capital good

Goods that are used in the production of other goods and services e.g. machinery, computers, vehicles. They will create more value than consumer good and contribute to economic growth.

The diagram below shows an economy that is positioned to produce either capital goods or consumer goods and because capital goods have a bigger influence on economic growth, this economy is slanted towards producing more capital goods compared to consumer goods. But, it is still positioned on the PPF and therefore is fully utilising all the resources available in the economy.


Capital goods

Goods that are used in the production of other goods and services e.g. machinery, computers, vehicles. They will create more value than consumer good and contribute to economic growth.

Capital Markets

Provides medium to long-term finance to firms and governments via long-term debt or equity. These instruments are illiquid as these instruments typically last for more than a year.

Below is a table to illustrate the methods in which different economic agents can obtain finance.


Capital Output Ratio

Measures the amount of capital that is needed to produce one unit of output and therefore is a measure of a country's capital productivity. This is one of two factors that the Harrod Domar Model states can affect economic growth substantially in developing and emerging economies.

Below is an illustration of how important the capital-output ratio is for development in emerging economies. If the capital-output ratio falls this is a positive note for a country's growth rate as it means less capital is needed to produce each extra unit of output. Therefore with the same capital input, output for a country should be boosted and generating a higher level of national income and output. However, if the ratio increases this reduces capital productivity per unit and leads to a lower level of output being produced and economic growth will slow.


Capital productivity

The quantity of output produced by each unit of capital.

Below is a table to show how capital productivity can vary with just one unit of labour operating them.


Capital spending

Money spent on infrastructure projects by the Government e.g. new schools and the high speed rail project (HS2). Funding is usually provided by borrowing money via the issue of Gilts so that the cost of capital projects can be spread to reflect the long term nature of the benefits the project is excepted to deliver.

Capital widening

Is when the capital levels increase at the same rate as labour input i.e. total capital increases but capital per worker remains constant.

Capital-output ratio

The amount of capital required to produce a given amount of goods. Assumed to be fixed within the model explaining the accelerator effect.

Capital-to-Loans Ratio

Is the amount of capital a bank needs to hold to back against a loan. The higher this ratio the smaler the maximum value of loans a bank can make and therefore the smaller the credit multiplier.


Capitalism

Factors of production are privately rather than state owned.

Cartel

These are price fixing agreements where individual firms are given production quotas for the given market.

Below is a diagram showing how a cartel gets formed in an industry and how it affects each of the individual firms involved. If each of the firms involved charge a price of P at their given quota they will make a high level of supernormal profits (shown by the red box) whilst more importantly maximising industry profits (MR=MC). The idea is that if firms stick to this production quota, profits across the industry will be maximised.

But the issue with a cartel is that firms have an incentive to 'cheat' - by producing more than their subscribed quota to ensure they can increase their level of abnormal profits. The diagram below shows how a cheating firm can charge at a lesser price and produce above their quantity to increase individual profits (shaded orange box).


Cash Ratio Deposit

Is a non-interest earning deposit from financial institutions placed into the central bank of the country of origin, to provide finance for the central bank and cash reserves for future liquidity problems. Currently in the UK financial institutions have to hold 0.5% of their asset values in the Bank of England.


Central bank

The institution responsible for maintaining a stable banking system by managing the currency, money supply and interest rates and to supervise commercial banks and provide finance in times of crisis (lender of last resort).

Below is a summary of the main policy initiatives that the Bank of England is responsible for, to enable the UK economy to function properly.


Ceteris paribus

Assuming that all other things remain the same. This is an important assumption in economics as it allows analysis to consider the impact of individual variables.

Choice Architecture

Is the design of different ways in which choices can be presented to consumers, and the impact of that presentation on consumer decision-making. There are three different varities of this: default choice, restricted choice and mandated choice. These are all more specific forms of framing.


Circular flow of Income

An economic model that explains how production and exchange of goods and services stimulate money flows within an economy.

Below is a diagram to illustrate how the money flows move within the economy, as well as external leakages and injections.


Claimant count

The number of people claiming Job Seekers Allowance (unemployment benefit). It does not necessarily represent the total number of unemployed people as many are excluded from claiming the benefit even though they do not have a job.

Below is a diagram to show the positional change in the claimant count in the UK from 1971-2014.


Classical economists

Believe in a laissez faire approach and that markets perform efficiently if individuals are left to their own devices and make decisions based on their own self interest with minimal government intervention.

In macroeconomics they distinguish short (upward sloping +) and long run (vertical) supply curve.


Closed economy

An economy that does not trade with other countries. Although there are very few practical or significant examples of this, making the assumption that an economy is closed is often made to explain and analyse various macroeconomic issues.

Cobweb Model

A period of market instability that is initiated by a supply side shock but converges back to equilibrium over several cycles because demand is more elastic than supply.

Below is a diagram to show how a disequilibrium converges to an equilibrium over time in a specific agricultural market.  A poor harvest in period 1 means supply falls to Q1 so that prices rise to P1. If producers plan their period 2 production under the expectation that this high price will continue, then the period 2 supply will be higher, at Q2. Therefore, prices fall to P2 when they try to sell all their output. As this process repeats itself i.e. between periods of low supply with high prices and then high supply with low prices, the price and quantity trace out a spiral. In the figure below, the economy converges to the equilibrium where supply and demand intersect. However this process can also work in the reverse in a diverging case - but that only happens when the supply curve is more elastic than the demand curve.


Cognitive Biases

A systematic limitation in a human's ability to think rationally about a situation. It is these cognitive biases which lead to irrational behaviour which ultimately is the driving force behind behavioural economics. For instance, one cognitive bias is the representative bias which causes individuals to fall for the gambler's fallacy and ultimately make incorrect decisions based on false beliefs.


Collateral

Is an asset that secures repayment on a loan i.e. a house in a mortgage loan or car in a car loan.


Collusion

When rival firms within an industry co-operate for their own mutual benefit i.e. to maximise profits. There are different types of firm collusion such as overt collusion and tacit collusion.

The flowchart below depicts the logical sequence of an example of collusion which is anti-competitive i.e. predatory pricing. This like all forms of collusion is legally prohibited but firms with superior financial resources to other firms have the ability and incentive to collude to protect their market share and position.


Command Economy

An economic system that operates in a different way to capitalism. The state decides what goods and services are produced and how they are distributed.

Commercial bank

An institution licensed to receive and hold deposits, that enables monetary transactions and creates credit. Deposits are used to finance loans that earn a high enough rate of interest to earn a profit after payment of interest to depositors and covering the cost of administration and bad debts.

Below is an illustration of the main activities that a commerical bank undertakes i.e. deposit-taking and lending activites to the retail and household sectors of the economy. They are often called intermediairies because they intermediate funds between surplus units (savers) and deficit units (borrowers).


Commodity markets

Markets that trade large quantities of raw materials e.g agricultural products such as wheat, sugar and cocoa and mined/extracted products like copper, gold, silver and petroleum.

Comparative Advantage

If a country experiences a differential absolute advantage in both goods this generates a difference in the opportunity cost of production and provides incentives for both countries to specialise and trade.

The following example demonstrates how although France has an absolute advantage in the production of both goods it does not benefit from a comparative advantage in the production of both goods. France has a comparative advantage in wine but not in milk as Poland has a comparative advantage in this product. This will become clear by calculating the opportunity cost of producing each good for each of the two countries.

The opportunity cost = production gained /production lost. For example, if a country divides resources evenly between two goods and makes 3 wine and 4 milk it can make another 3 wine if it gives up 4 milk. So production gained is 3 wine / production lost is 4 milk. This means that the opportunity cost of producing 1 extra wine is 1.33 milk (i.e. 3/4). The table shows that France has the lowest wine opportunity cost and Poland has the lowest milk opportunity cost. France specialises in wine and Poland in milk.

If you find the calculations are challenging it is sometimes easier to start by drawing PPFs which are non parallel but do not intersect (see below). A Some students may find it easier to draw the graph and then analyse the relationship between PPFs to determine comparative advantages:

  1. The most efficient country (PPF furthest from origin = France) has a comp advantage in the good exhibiting the LARGEST difference in production i.e. the good plotted on the axis where the difference between the 2 PPFs is LARGEST = wine.
  2. The least efficient country (PPF closest to the origin = Poland) has a comp advantage in the good exhibiting the SMALLEST difference in production i.e. the good plotted on the axis where the difference between the two PPFs is SMALLEST = milk.


Competing supply

Situations where factors of production can be used to produce different goods so that an increase in the supply of one commodity requires a reduction in the supply of another commodity.

Below is a diagram to illustrate this in a supply and demand framework. In this instance farmers use their land to rear animals to produce products such as beef and lamb. However if farmers decide to use more land to rear cows to help produce more beef this causes the supply of beef to increase. However, as land is required to rear other animals such as land, if there is less land available to rear sheep then the supply of lamb will fall. This is all caused because of scarce supply of land.


Competition and Markets Authority

A new organisation formed to replace many of the functions performed by the Competition Commission and the Office of Fair Trading. The organisation becomes effective from April 2014. Its purpose is to promote competition and make markets work well for consumers, businesses and the economy.

Competitive demand

Markets where number of substitutes exist and one good can be purchased instead of another good.

Below is a diagram to illustrate two substitute products in a supply and demand framework. Beef and pork are both substitutes as most consumers class them as similar goods and very rarely buy both goods at the same time. A fall in the supply of beef creates excess demand and the price of beef rises, leads to a sharp fall in demand . However, because the price of beef is higher consumers to switch to a cheaper substitute (pork) and as a result this forces the demand for pork up as it is a key substitute to beef.


Competitive market

Are markets in which no individual buyer or seller can influence the market outcome.

Below is a diagram to illustrate a competitive market using a supply and demand framework. In this market an equilibrium price is reached by demand and supply equalising and the goods that are produced at this price get allocated to those consumers which value them the most. Any disequilibrium is soon cancelled out via market forces i.e. the price mechanism.


Complementary good

A good which is purchased alongside another good as the combined outcome helps to satisfy a want or desire e.g. milk and tea

Complementary goods

A good which is purchased alongside another good as they need to be consumed together to satisfy a want or desire.

Below is a diagram to illustrate complementary goods in a demand and supply framework. Pasta and pasta sauce are two goods which need to be consumed together and therefore are complementary goods. As the diagrams below show, an increase in supply of pasta leads to a fall in the price due to excess supply. If the price of pasta falls, demand increases for pasta but this will also cause the demand for pasta sauce to increase as they are complementary goods. Hence why the demand curve for pasta sauce shifts outwards.


Complete market failure

When a market completely fails to provide a good or service. This is largely restricted to pure public goods e.g. defence.

Below is a diagram to illustrate market failure which is created with pure public goods such as national defence. There is market failure because despite a demand for these types of goods nobody in the market is willing to supply them because of the free-rider problem.


Composite demand

A situation where a good is demanded for a variety of different reasons e.g. timber is demanded to make houses, furniture, paper and many other purposes.

Below is a diagram to illustrate composite demand for a product that has many uses in alternative markets, oil. In the diagrams below an increase in demand for oil from plastic producing firms, has to result in a fall in the supply of oil in the petrol market as oil is a composite product has lots of alternative uses. This logic could be applied to other products such as bread and steel.

composite demand


Compulsory break up

A form of regulation when companies are forced to down size by selling parts of their business e.g. The EU ordered Lloyds Bank plc to sell parts of their retail banking business after it merged with HBOS plc.

Concentration Ratio

Summarises how much of the entire market the largest firms control.

Below is an illustration of how to calculate a specific n-firm ratio. In this case to find the 3-firm concentration ratio (the combined market share of the three largest firms) all that is required is to identify the three firms with highest market share and add these sums together as shown. The fact that the ratio is 77%, signifies that this is not a very comeptitive market as these three firms control over three quarters of the market.


Congestible public good

These are public goods that become rival when they are heavily used e.g. during rush hour the usage of roads by each additional car causes congestion that diminishes the utility of other drivers. By charging a toll to control congestion the good becomes excludable during toll hours.

Congestible public goods

These are public goods that become rival when they are heavily used e.g. during rush hour the usage of roads by each additional car causes congestion that diminishes the utility of other drivers. By charging a toll to control congestion the good becomes excludable during toll hours.

Conglomerate Integration

Type of integration referring to the mergers or acquisitions between busineses which operate in different markets.

Below is a graphic to illustrate the perceived benefits of a conglomerate merger and the possible motives behind firms involved in the merging process. The idea is that just like stock portfolios the best strategy is to diversify to minimise risk i.e. to move into as many markets as possible, so if one market collapses the exosure to risk is low and any losses can be offset by gains in the other markets. This type of integration can also foster innovation and invention by allowing new ideas and approaches to be implemented from agents that specialise in different markets. Finally the larger the company the more economies of scale opportunites are available and that can only benefit the profit channel of the companies involved.


Constant Returns to Scale

When a firm increases all the factors of production by a factor and output increases by an equal factor. As a result the average cost for the firm stays constant.

Below is an illustration of how a business would achieve constant returns to scale. Assuming this firm only uses capital and labour as its inputs. A doubiling of the capital and labour input leads to a doubling of output as well. Because the average cost is calculated by the total costs/output, if the costs are increasing proportionately with output, average costs do not change.


Consumer good

Are consumed to satisfy the personal wants and needs of consumers. They are not used to produce other goods in the way that capital goods are.

Consumer goods

Are consumed to satisfy the personal wants and needs of consumers. They are not used to produce other goods in the way that capital goods are.

Consumer Price Index

The measure used by Government to set the inflation target for the Bank of England. It is different to the Retail Prices Index as it does not reflect inflation associated with housing costs (e.g. mortgage interest and council tax). This price index is often shortened to CPI.

CPI is calculated as follows. Firstly a basket of goods are selected based on the spending patterns of the average household and then weights are attached to each good reflecting the importance of that good to families. Then several price surveys are carried out to work out the average prices of these goods. The CPI can then be compared year on year with subtle changes to the baskets of goods to monitor how the overall inflation rate in the economy is developing and changing.

Below is a figure that traces the annual CPI percentage change for the UK from 2005.


Consumer Sovereignty

The production of goods and services in influenced by the preferences of consumers.


Consumer surplus

The amount of money consumers save because the equilibrium price is lower than the maximum price they are prepared to pay for the good or service.

This is always illustrated for any region above the market price and below the demand curve as the diagram below highlights.

It is important to remember that consumer surplus measures the accumulated gain that consumers receive for buying a good at a price lower than their maximum willingness to pay (given by the demand curve) and not the individual gain.


Consumer tax burden

The amount by which consumer surplus is reduced by the imposition of an indirect tax. However, the elasticity of the demand curve affects how much of the tax is passed onto consumers.

Below is a diagram to illustrate how the imposition of an indirect tax implaces a burden on consumers. In this instance the demand curve is neither inelastic or elastic and therefore the tax burden is split evenly between the consumers and producers.

Below is a diagram to illustrate when the demand curve is inelastic and therefore the tax burden is split unevenly towards consumers ahead of producers.

Below is a diagram to illustrate when the demand curve is elastic and therefore the tax burden on consumers is small.


Consumers

People who purchase and are the end users of a good or service.

Consumption

In macroeconomics this is the amount of money that households spend on goods and services over a given period of time. In microeconomics this means purchasing and then using or experiencing goods or services.

Consumption externality

Externalities that arise from the consumption of a good.

Consumption function

An equation that explains the relative influence of different factors on the consumption of households.

Below is an example of a consumption function in which the level of consumption is directly related to the level of disposable income. The following consumption function (C = xYd +c) has a slope equal to x, which represents the marginal propensity to consume for a consumer. There are different varieties of consumption functions some of a convex or concave shape. But the one below illustrates a linear consumption function with a constant level of MPC throughout all levels of disposable income i.e. consumers will always spend the same fraction of a new amount of disposable income regardless of their current level of income.


Contagion

Is when the collapse of bank can create bank runs on other healthy banks depsite those banks not appearing to have any liquidity/solvency problems. This is caused due to the asymmetrical infromation which prevents depositors to be able to forensically analyse a bank's balance sheet and assess the risks that this bank has taken on. Therefore they determine the riskiness of their bank by looking at close substitute banks.


Contestability

A contestable market is a type of market structure in which firms can enter and exit freely and costlessly, therefore making the incumbent firms vulnerable from hit-and-run entry. Due to the freedom of entry and exit there must be an insignificant level of sunk costs attached to competing in these types of market.

Below is a graphic to illustrate the main characteristics of a contestable market. For instance the firms that wish to engage in hit-and-run entry need to be classed as profit maximisers, otherwise the incentive to undercut the incumbent firms will not exist. Firms also need to have perfect information to be able to undertake successful hit-and-run entry. Finally the key factor is that firms need to be able to enter absolutely freely and exit absolutely costlessly.


Contractionary fiscal policy

Changes in taxation or expenditure in order to reduce demand in an economy

Below is a graph to breakdown the economic effects of a government running a contractionary fiscal policy in an AD/AS framework. This can be achieved through raising taxes, decreasing government expenditure or possibly both from the classical viewpoint. The immediate impact is that the AD curve shifts inwards creating a decelerating inflation rate.

It it important to note that the impact on economic growth depends on which sectors of the economy the fiscal policy was targeted. As a cut in spending towards productive sectors of the economy could cause the LRAS curve to inwardly shift. This is a key evaluation point to mention when dealing with fiscal policy.


Copyright

A legal measure that can be used to protect most forms of written work as it either deters third parties from using and benefiting from its use or provides a legal remedy for recovering compensation from its unauthorised use.

Corporate Bonds

A corporate bond is a bond issued by a firm in order to raise financing for a variety of reasons such as to finance business expansion or to finance a takeover deal. These bonds usually relate to longer-term debt instruments and therefoe have a maturity of at least a year.

Below is a flowchart to illustrate the process and details behind the issuing of bonds.


Corporation tax

Corporation Tax is a tax on the taxable profits of limited companies and other organisations including clubs, societies, associations and other unincorporated bodies. The rate of tax is 20% rising to 23% for high levels of profits.

Cost push inflation

An increase in the price level due to an increase in production costs e.g. taxes, wages, utility or component prices. The cost increase will cause a negative shift in the SRAS curve. This causes prices to rise as costs push the supply curve up the aggregate demand curve.

Below is a diagram to show the impact of production costs rising over time, leading to a period of stagflation for the economy (inflation and negative growth). Generally it is any increase in factor of production cost that instigates the inward SRAS curve shift (increase in wages or higher prices for commodities such as oil). But there are also outside influences that could create this curve shift as well e.g. external inflation and higher taxes.

The factors that would create this type of inflationary pressure are:

  • Increases in labour costs
  • Increases in price of raw materials/commodities
  • Increases in the cost of imports (weaker currency)
  • Increases in the cost of capital

Because this type of inflation is brought about by production cost changes and not a stimulation in economic activity, it is perceived as the worst form of inflation an economy can experience when compared to consumption driven or investment driven inflation (demand pull inflation). This is because unlike with demand pull inflation, there is no opportunity for the LRAS curve to expand in the long-run to create disinflationary growth and return the economy back to full employment.

Cost push inflation can also lead to more severe changes in the price level if it is part of an inflationary spiral as shown below. This is created originally because of an increase in production costs moving the economy below the full employment and moving the economy to point B, as before. However, the rising costs of production can boost the disposable incomes of the owners of the factors of production (particularly if brought about by higher wages) which can result in an increase in spending and economic activity assuming ceteris paribus (depending on the marginal propensity to consume and save). This causes the AD curve to expand and moves the economy back to the full employment output level at point C. Crucially though, this leads to further inflationary pressures as the price level has now increased to P3. The spiral can then continue because if prices in the economy are increasing quickly, workers will bargain for higher wages to ensure in real terms they are made no worse off. This further increase in production costs for firms forces the SRAS curve inwards once again and a new macroeconomic equilibrium is settled at point D, stoking inflationary pressures even higher (P4). This process can continue and introduce crippling high inflation rates for a country.


An evaluation point to mention here is that if this type of inflation is sustained for a long period of time then it could damage the long term growth prospects of a country and in the process erode living standards.


Costs

Amounts of money spent on factors of production to produce goods and services.

Council tax

A tax imposed by councils to cover the cost of local services. The amount of tax levied depends on the relative value of the property occupied.

Coupon Payment

A periodic payment that the bondholder receives during the time between when the bond is issued and when it matures. An example of this is the fixed annual payments made by the Government to the holders of Gilt Edged Securities.


Covenant

Is a contract that legally prescribes individuals tied to the contract to obey all the clauses and conditions contained in the legally binding contract. In financial markets, banks often draw up restrictive covenants when lending sums of money to businesses to reduce the probability of the business defaulting on that loan. It is called a restrictive covenant as the bank can prevent the business from paying out extra dividends to shareholders and taking more equity to finance investment plans until the loan has been paid back to the bank. These types of contracts are drawn up to reduce the problem of moral hazard.


Creative Destruction

A theory of economic innovation identified by Joseph Schumpeter, which describes the "process of industrial mutation that incessantly revolutionizes the economic structure from within, incessantly destroying the old one, incessantly creating a new one" i.e. new technology replaces old processes, similtaneously creating and destroying jobs and markets.

Below is an illustration of what creative innovation and invention leads to but also how it can offet these effects by destroying some exisintg markets and jobs that go with it. A modern example of this is the Uber taxi service putting pressure on traditional taxi service companies in the largest cities in the world.


Credit

Where one party to provides money to another party where that second party does not reimburse the first party immediately (thereby generating a debt), but instead arranges either to repay or return those resources (or other materials of equal value) at a later date. The most common form of credit created in the financial sector are loans/advances.


Credit Crunch

A period of financial crisis when loan repayment uncertainties mean banks become reluctant to lend money to each other, causing interest rates to rise and for sources of credit to diminish. Such periods will be characterised by central bank intervention to ensure the banking system can continue to operate by providing additional liquidity (credit) until normal lending resumes.

Credit Multiplier

Is a model that illustrates how banks can create money. The rate at which credit is created depends on the reserve ratio and the capital ratio for banks.

Below is the formula to calculat the credit multiplier i.e. the change in deposits divided by the change in reserves.


Credit rating

An evaluation of the credit worthiness of an individual, firm, government or other organisation. Stronger credit ratings will provide access to lower rates of interest on loans.

Below is a table of some of the countries credit ratings - in terms of the perception of their ability to repay and meet their debt obligations. In this instance Australia has the highest rating according to S&P meaning they are a very safe and secure country to lend too. In contrast to this Puerto Rico have an extremely low credit rating and therefore if they are to secure finance they will have to pay huge interest on top of the principal. This often leads to the trend that countries that need to borrow cannot do so due to their deteriorating credit ratings. These ratings are correct as of October 2015.

Credit ratings are usually undertaken by specialist credit ratings agencies and are considered by financial organisations in the day to day management of assets. S&P, Moody's and Fitch are probably the three most well known credit rating agencies. There is s strong relationship between a sovereign nation's credit rating and the rate of interest that needs to be paid on new borrowings. The best credit ratings (AAA) are able to command the lowest rate of interest on financial markets.


Credit Union

A mutually organised, non-profit depository institution which aims to provide finance for individuals as well as setting up accounts for individuals to store their savings and wages.


Creditworthiness

Is a judgement about an economic agent's current and future ability to honour debt obligations. Bank's often use credit ratings provided by external credit rating agencies to analyse the credit ratings of business and countries to decide whether they should provide a loan for a particular entity.

Below is a list of countries credit ratings for debt they hold, as rated by Standard & Poor's as of Ocotber 2015.


Cross elasticity of demand

The proportionate change in the quantity demanded of a good in response to a proportionate change in the price of another good.

The formula for this is given below:

If the XED value is positive, the two goods in question can be classed as substitutes as the rise in the price of one good leads to a rise in the quantity of the other good. As consumers switch away from consuming the higher priced good and buy the other good instead e.g. Pepsi and Coke. If the XED value exceeds 1 this indicates that the two goods in question are close substitutes i.e. as the price of Good B rises by 1% then the quantity demanded of Good B will rise by more than 1%. The closer the substitutability between products the greater the positive XED value becomes.

If the XED value is negative, the two goods in question can be classed as compliments as the rise in the price of one good leads to a fall in the quantity of the other good. This is because as the goods are goods which should be consumed together, if one becomes more expensive consumers will stop buying both goods e.g. pasta and pasta sauce. If the XED value lies below -1, the goods in question are very complimentary and therefore the quantity demanded of Good A will respond sensitively to the price of Good B.

Cross elasticity of demand can be used to show the relationship between related goods and can provide useful information for firms that are competing in markets with a high level of interdependence. 


Crowding-out

The benefits associated with increased government spending funded by borrowing money may be offset by reduced consumption and investment if this reduces the credit available to firms and individuals.

Below is a diagram to illustrate the crowding-out effects of financing a budget deficit. When the government wishes to finance a budget deficit they have to borrow from the private financial sector. By doing this it pushes the demand for loanable funds outwards putting presurre on interest rates to rise. Given that investment is a component of aggregate demand and is negatively related to the interest rate (as the interest rate represents the opportunity cost of investing), a higher interest rate causes individual investment projects to be less profitable and therefore investment falls. Also given the fact that interest rates are higher it makes consumption lower due to difficulties trying to acquire finance from financial institutions. Therefore despite the government stimulating the economy by running a larger budget deficit the effect on real output will be muted due to lower consumption and investment offsetting these expansionary effects. This is shown by the position of the final AD3 curve.


Currency Union

Describes a situation where a group of countries adopt and share a common currency between them.

A currency union is often established to help an economic and political union function more effectively. This is because if all countries within the union share the same currency it makes it easier for common economic policies to be introduced and implemented across all union countries and therefore theoretically creates stable and certain economic conditions across all member states.

The easiest way tot understand the fundamentals behind how a currency union operates and the impact it has on member states, is to look at a real world example. The greatest example of this type of union is the Eurozone. This is a currency union made up of 19 countries from the European Union, that have replaced their own national currencies with the Euro. This monetary union was established in 1999 and the common currency (euro) is controlled by the common central bank (European Central Bank). The Eurozone is open to any country that can fulfill the convergence criteria i.e. membership is successful if countries can provide evidence they will not introduce unwanted destabilising effects into the union. This convergence criteria focuses on the countries performance regarded the main macroeconomic objectives (e.g. inflation, government finances). The main characteristics of this type of union are:

  • Common Currency - All countries must replace their own national currencies with the single currency, the euro.
  • Common Central Bank - A single independent central bank must be in charge of setting the monetary policy instruments for the entire currency union i.e. interest rates. For the Eurozone, this central bank is called the ECB (European Central Bank) and is an independent body responsible for the distribution of notes and coins of euros across the Eurozone, deciding on the interest rates for members in light of achieving an inflation target, maintaining stability in the financial system and markets and holding foreign currency reserves to intervene in the the foreign exchange market to affect the value of the euro against other currencies. 
  • Stability and Growth Pact - All countries must ensure that government borrowing is limited to just 3 per cent of GDP, to ensure fiscal stability is maintained across the region.

Countries decide to enter a currency union on the basis that it helps a country achieve greater certainty and stability within their own respective economies. This stability helps foster other advantages, such as:

  • Exchange Rate risks and costs are eliminated - Exchange rate fluctuations between union countries that used to exist will now no longer exist because of the fact that all countries have adopted the same currency. This means uncertainty regarding the value of national currencies have been removed and this encourages countries to engage in more intra-union trade and investment as a result of the reduction in uncertainty.
  • Transaction costs reduced - As all countries are using the same currency, countries no longer need to pay for the transaction costs of converting their own national currency into a foreign currency when importing goods from other countries inside the union. This benefits all firms operating in countries within the currency union and will boost the real output (GDP) for a country.
  • Easier price comparisons - When countries use a single currency it makes price comparisons easier across the union, as consumers do not have to account for differences in the values of national currencies. Therefore, from the consumer's perspective it makes it easier for them to obtain the information that is necessary for them to buy the good for the cheapest possible price. From the firms perspective it means firms cannot get away with charging different prices to different countries as they will be exposed by the single currency. This advantage could mean that prices remain stable and equalise across the union and this is a boost for consumers. 
  • Economies of Scale - The increased certainty and stability that comes from the elimination of exchange rate risks and costs means that firms are more likely to engage in large scale production to sell goods to the entire union, rather than individual countries and this is likely to yield lower prices for consumers. 
  • Increased FDI - Countries operating in the rest of the world have a greater incentive to invest in countries inside the Eurozone because it allows firms from the rest of the world to sell goods to European countries without any euro exchange rate fluctuations. This points to why FDI in the UK has been falling over time as global firms do not want to be subject to exchange rate fluctuations regarding the pound and the euro.

However as large as the benefits of becoming a member of a currency union are perceived to be there are also some significant costs attached to adopting a single currency as well. The costs are as follows:

  • Conversion Costs - When countries switch from their own national currency to a single currency there are currency conversion costs that have to be incurred when converting all the coins and notes in circulation currently. This is a process which can take time and cause consumers slight problems in terms of adopting to new currency and pricing system. 
  • Loss of Monetary Policy Autonomy - When a country becomes part of a currency union they had to sacrifice their own national monetary policy independence as the common central bank is in charge of setting interest rates and the money supply. This is problematic for union countries as they no longer have the ability to influence their own domestic economy via setting their own interest rates and own monetary policy. Which means policymakers are restricted when it comes to combating and responding to economic shocks as interest rates can no longer be influenced to affect the inflation, unemployment and growth rate. However, the loss of monetary policy independence is only an issue if countries within the union are asymmetric i.e. their business cycles are not aligned. This is because the one size fits all monetary policy set by the ECB works effectively if all countries business cycles move symmetrically. As the interest rate that needs to be set to help all countries achieve macroeconomic stability will be at the same level. However, if some countries experience a recession and other countries experience a boom, it is very difficult for the ECB to set an interest rate that is optimal for all countries.  
  • Lack of Fiscal Union - To achieve political and economic stability across the union there not only needs to be macroeconomic stability but also fiscal stability as well. Because a currency union like the Eurozone does not have a fiscal union in place it makes it very difficult to incentivise all countries to become fiscally responsible. The stability and Growth Pact which was created to ensure that fiscal stability was created is often breached by countries that are facing a recession.
  • Lack of independency - The ECB is meant to be an independent body that sets the interest rate for the Eurozone but often the ECB sets the interest rate that is appropriate to the most powerful countries within the Eurozone such as Germany and France. This perhaps explains why these are the best performing countries within the euro. 
  • Loss of Sovereignty - The fact that the decision of the implementation of national policies are being passed onto foreign institutions such as the ECB means there is a loss of national sovereignty for certain countries since the control of monetary and exchange rate policy are no longer in countries hands.

When a country joins a single currency like the Euro it can exist in either two states. The net effect is that advantages exceed the disadvantages and there is a positive impact on Aggregate Demand and the LRAS curve as a result of increased intra-union trade and investment. Therefore dis inflationary growth is achieved. This is what is seen in the strongest Eurozone economies such as Germany. However, it may well be a country is in a position where the disadvantages exceed the advantages and this causes demand to stagnate and growth to fall, as the AD and LRAS curves shift inwards. This is seen in struggling Eurozone countries like Greece. The states are illustrated below.

The key question when analysing a currency union like the Eurozone is determining whether becoming a member of this type of union is beneficial or costly for a particular country. But it almost impossible theoretically to say whether a country joining a single currency will be made better-off or worse-off. As each country is in a different position in terms of trading patterns and exposed to different types of economic shocks. Therefore, in an exam situation when evaluating the decision of a country to join a single currency, the focus should be on what economic conditions need to satisfied for membership of a single currency to be optimal and what conditions need to be present for membership to be a disaster for a country. 

Therefore countries like the UK use a series of tests to assess whether becoming a member of a single currency like the Euro will introduce net benefits or net costs. In 1997, Gordon Brown introduced a series of tests which would have to be met and passed if the UK would find it beneficial to drop the Pound in exchange for the Euro. The five tests concerned : compatibaility, ability to manage financial problems, attraction of investment into the UK, level of benefits passed onto banks and the ability to create sustainable growth. Since 1997, the UK has never been able to meet all of the criteria and therefore have found it beneficial to maintain their own national currency. From the UK's perspective the view is that UK continues to use the pound sterling because the benefits brought about by remaining to use their own national currency is a critical success factor behind the economic growth rate of the UK.


Current account

An account within the Balance of Payments that records trade in goods and services.

Current account deficit

The value of imports exceed the value of exports.

Below is a diagram to show the process of running a current account deficit i.e. in order to run a current account deficit the government must run up a financial account surplus to borrow the funds to finance the country's marginal propensity to import.


Current account equilibrium

The value of imports equal the value of exports.

Below is a diagram to show the process of running a balanced current account. No borrowing or lending is required with this current account position.


Current account surplus

The value of exports exceed the value of imports.

Below is a diagram to show the process of running a current account surplus i.e. in order to run a current account surplus the government must run up a financial account deficit to lend the funds to other countries wishing to run up a current account deficit, as this earns interest rather than sitting in the government's coffers.


Current Ratio

A financial ratio used to test a bank's liquidity by deriving the proportion of current assets available to cover current liabilities. This ratio helps to gauge whether a company's liquid assets e.g money market instruments, are readily available to pay off short-term liabilities such as deposits. Generally the higher the ratio the safer the bank is perceived to be.


Current spending

The ongoing cost of running the government and the services it provides.

Cycle of Poverty

A phenomenon where poor families become impoverished for at least three generations.

Below is a graphical depiction of the cycle of poverty.


Cyclical unemployment

Unemployment that is created as a result of a lack of demand and therefore AD is not sufficient to achieve output consistent with full employment. This type of unemployment is sometimes referred to as demand deficient unemployment.

Below is a diagram to illustrate how cyclical unemployment occurs in an aggregate demand and aggregate supply framework. The AD shifts inwards and as a result firms value workers less due to the lack of products that need to be made. This is the type of unemployment that often occurs during downturns in the economic cycle as demand starts to flag. In this instance the AD curve shifting inwards has the caused the unemployment rate to go from 5% to 9%.

AS the name suggests this type of unemployment is often unpreventable as it is a result of the natural downturn in a country's economic cycle i.e. there are periods in which workers are required to produce high amounts of output and periods where workers are not required as much to produce goods and services. 


Dead Weight Loss

Is the loss to society that market failure creates.

The diagram below highlights a monopoly market structure, in which a deadweight loss is created because of the presence of monopoly power i.e. restriction of output and a rise in prices - leading to the welfare of society to be lower with presence of the monopoly compared to a perfectly competitive market.


Debt

The money owed by one party, the borrower or debtor, to a second party, the lender or reditor. Debt is issued by firms through selling bonds to finance expansion plans. Governments finance budget deficits through selling government bonds (government debt).

Below is a graphical sequence of how the government issues debt to finance a budget deficit, with the dangers of accumulated large amounts of national debt.


Debt Management Office

Is an executive agency of HM Treasury responsible for issuing and managing government debt. www.dmo.gov.uk

Debt Overhang

The process in which economic agents try to reduce the overall burden of debt they owe due to this debt constraining their ability to borrow in the future. This therefore prevents consumer spending amongst consumers and investment from businesses even if the new borrowing required to finance those expenditure plans is an economically beneficial investment with sustained benefits. This expalins why in economies when priavte sector becomes too high the level of savings will increase.


Decision-Theoretic Situation

These are situations in which the player's involved do not have to take into account the reaction of rival player's when setting their own startegic variable such as price or quantity. Therefore in these situations game theory cannot help predict the equilibrium condition to the game as interdependency does not exist. The most commonly used situations for these are extreme market structures such as a monopoly or perfectly competitive markets.

Below highlights three examples of firms in which would be classed a decision theoretic situation i.e. Microsoft Windows have such a dominant position in the PC market that they often do not have to consider the pricing strategies of rivals and therefore game theory would not be a useful concept to analyse these types of situations.


Decreasing Returns to Scale

When a firm increases all the factors of production by a factor and output increases by a smaller factor. As a result this causes the firm's average cost to rise.

Below is an illustration of how a business would achieve decreasing returns to scale. Assuming this firm only uses capital and labour as its inputs. A doubling of the capital and labour input leads to a lower than two-fold increase in output. Because the average cost is calculated by the total costs/output, if the costs are increasing quicker than output, average costs are rising.


Default Choice

When offered a choice individuals have a tendency to stick to the default option. This is because it requires effort to deliberately move away from the default choice.

This is why when many individuals give you a free trial of a subscription service many people continue to use it even after the trial has ended. As the individual automatically starts paying for the service as that is the default option, despite being offered the option to cancel before the first subscription period starts. There is also a similar notion in the UK pension schemes, shown in the diagram below.


Deficit financing

When government expenditure exceeds tax revenue and money is borrowed to cover any shortfall to avoid reducing expenditure or increasing taxes.

In order for the government to finance the budget deficit they must borrow from the private sector - pushing up the demand for loanable funds and interest rates. Despite allowing the government to spend more, this can lead to offsetting crowding-out effects. The diagram below shows the effect of running a higher government budget deficit in the loanable funds market.


Deflation

A persistent fall in the price level within an economy over a period of time, resulting in the inflation rate falling below 0% (negative inflation). As a result, this causes the value of money in the economy to rise, as each unit of currency now buys more units of goods and services. There are many real world cases of deflation as very rarely does a country experience a negative inflation rate (falling price level over time).

However, it is important to make the distinction between a falling inflation rate and deflation. If a country has a falling inflation rate this is classed as disinflation as it is an example of an inflation rate that is rising at a slower rate than before - this is because inflation always concerns rising prices. Only when the inflation rate becomes negative can it be classed as deflation - as technically at this point the general price level is falling from one period to the next. 

Deflation can be created by two separate factors:

  • Supply Side Improvements - Positive supply curve shift (SRAS shift in short-run, LRAS shift in the long-run).
  • Decrease in Economic Activity - Inward Aggregate Demand curve shift

These two causes ultimately create pressure for prices in the economy to fall over time, as a result of a deflationary output gap being created. 

Despite the price level falling in both cases, the wider impacts on the economy vary depending on which curve has shifted. For instance, under a demand curve contraction it not only causes the price level to fall but real output and employment move the same way too. The long-run impact of this could be that business confidence and profits are hit and may cause firms to stop investing which contracts the AD curve even further, resulting in an even more significant price level fall. The positive supply side shock does not create these systemic problems in the economy and if accompanied with a LRAS curve shift could lead to the capacity of the economy to expand. This is why quite often the positive supply side shock is referred to as 'good deflation' whilst the AD contraction is referred to as 'bad deflation. 

However, often it is common for both factors to play their part in a country being caught in a deflationary spiral. If prices fall significantly from P1 to P2 via a positive supply side shock, then this causes consumers to delay their purchases, in anticipation of further price falls in the future. Doing so, causes the level of economic activity to fall and this causes the aggregate demand curve to contract in response to that. This causes the price level to fall even further to P3. Suddenly the economy has been plunged into a deflationary spiral. This is shown in the diagram below:

This is called a deflationary spiral as the cycle of falling prices continues for potentially a very long time i.e. deflation in Japan. This is because firms realise that consumers are delaying spending until prices fall, so therefore they have to cut prices in order to gain some revenue. But doing so, reduces their margins and this causes investment levels from firms to fall which can reduce the AD curve and price level to fall even further.

Deflation is often seen as a sign of a fragile economy as domestic economic activity wains, creating problems such as:

  1. Deferred consumption 
  2. Damages consumer and business confidence
  3. Lower business profits and investment
  4. Increase in the debt burden (increase in real cost of borrowing)
  5. Increased probability of loan defaults
  6. Damages economic growth

However, when evaluating the impact of deflation on the macroeconomic performance of an economy it all depends on weighing up the short-run benefits of lower prices for goods against the long-run costs of a consistently falling price level. This is because deflation is not necessarily a problem in an economy, as long as it is only temporary, as consumers enjoy the short-term boost of lower prices and firms enjoy the higher quantity of sales despite the fall in prices. But if sustained for a longer period of time then this introduces deferred consumption and this is where the margins and profits of firms starts to become significantly affected. 

The main evaluation points when considering the impact of deflation on an economy are as follows:

  • Extent of Deflation (e.g. size of curve shift)
  • Duration of Deflation (e.g. short-term or long-term effects)
  • Scale of Deflation (e.g. national or worldwide scale)
  • Impact on Competitiveness (e.g. relative inflation rate)
  • Impact on Economic Agents (e.g. confidence, investment, profit and consumption)
  • Possible Policy Response (e.g. effectiveness of policies) 

Deflationary output gap

When an output gap arises from a negative shift in AD (negative output gap) or positive shift in SRAS (positive output gap) and leads to a fall in the price level.

Below is a diagram to illustrate the output gaps which create a fall in the price level.


Degree of concentration

A measure of how much of a good or service is supplied by the largest suppliers in a market.

Deindustrialisation

When the structure of an economy changes because activity shifts from the secondary to the tertiary sector.

Demand

The amount of a good or service consumers will buy at any given price over a certain period of time.

Below is a diagram to show the demand curve for a good in a specific goods market.


Demand curve

A curve (typically drawn as a straight line) which shows the amount of a good or service consumers would buy at any given price. The inverse relationship between the price and quantity demanded of a good or service is explained by the 'Law of Demand'.


Demand for substitute goods

When there is demand for a good that is cheaper but satisfies the same wants or needs as another good.

Demand movement

A demand curve movement is created when the price of a good or service, that the demand curve represents, changes. Because of the inverse relationship between the price and quantity demanded of a good, when the price of a good falls the quantity demanded rises, whilst in the case of a price rise the opposite occurs. This i all subject to the law of demand. If any non-price factor changes then this causes the demand curve to shift at every given price.


Demand pull inflation

An increase in the price level due to a positive shift in the aggregate demand curve i.e. prices rise as demand pulls the AD curve up the supply curve.

The increase in AD can arise from any positive changes in: consumption, investment, government spending or net exports.

Below is a set of diagrams to highlight the two different approaches to showing demand-pull inflation in an economy. The Keynesian AS curve provides a clearer path to evaluating the impact of demand curve shifts on the inflation rate. In the classical case, the inflation is created by an outward AD shift with no change in the SRAS curve assuming ceteris paribus.

However, when evaluating this type of inflation it is important to understand the main cause of the positive AD shift. This is because if the AD shift was caused by increased consumption brought on by higher consumer confidence, then it is likely to create an inflationary spiral, in which real output remains unchanged but the price level increases significantly. This is essentially an inflationary movement up the LRAS curve without any real gains for economic agents. However, if the AD curve shift was brought about through higher investment, this is likely to have strong productivity links to the economy (e.g. increase in rate of capital accumulation). As a result, it can create pressure for the LRAS curve to outwardly shift and the economy goes through a period of disinflationary growth. So it is important to consider what factor has driven the demand-pull inflation to evaluate its impact on the performance of the economy. 


Also the degree and extent of demand-pull inflation introduced in the economy from an AD shift depends crucially on the level of spare capacity in the economy. This Is because if an economy is at or close to full capacity, majority of the economic resources (e.g. factors of production) are in use. Therefore, any increase in demand creates pressure on an economy's existing endowment of resources to produce a higher level of output. It is this that creates the inflationary pressure for prices to rise as factors of production demand higher rewards for the increase in effort and work they have to put in to produce the extra output. This causes the economy to overheat and creates significant rises in prices.

However, when an economy has a significant level of spare capacity (significant amount of unemployed resources) an increase in demand and output does not put pressure on the existing set of resources currently employed, as firms can increase the amount of economic resources they employ in their production to fuel the higher output. This means the strain on the economy is lessened and the inflationary pressures are not as severe. This explains why the Bank of England closely monitor labour market data when making a decision on setting the base rate, in order to control inflationary pressures (e.g. the lower the unemployment rate, the greater the chance an increase in economic activity stokes inflation).

To illustrate the impact of spare capacity on inflationary pressures, it is best to use the Keynesian AS curve. 


Demand side fiscal policy

Changes in taxation or expenditure that are designed to influence (positive or negative) AD in the economy. 

There are two types of demand side fiscal policy:

  • Contractionary Fiscal Policy - shifs AD curve to AD2.
  • Expansionary Fiscal Policy - shifts AD curve to AD3.


Demand side shock

This a major economic event that leads to a shift (positive or negative) in the AD curve. The event is often sudden and unexpected e.g. credit crunch leading to a demand-side shock due to an almost immediate reduction in credit availability.


Demerging

Occurs when a firm decides to sell off a part of its operations in order to focus on core products, remove any diseconomies of scale, meet new regulations or meet changes in demand. This highlights that buinesses do not always decide to grow.


Demerit good

A good that is over-provided by the market and as a result becomes over-consumed by consumers. Tobacco, alcohol and fast food are all examples of this type of good. This is the opposite of a merit good.

The market failure created in these types of goods is caused by a divergence between the marginal private benefit and the marginal social benefit curves. This is because when individuals consume demerit goods it releases negative consumption externalities onto society. As a result, this means that the MSB curve always lies below the MPB curve and this leads to the good being over-consumed in the market. For instance, individuals that smoke cigarettes enjoy the private benefits of smoking - the satisfaction they receive from smoking today. However, it also creates several external costs, which get passed onto society (third parties) that perhaps - due to the presence of imperfect information - the smoker does not acknowledge. The external costs of smoking include: second hand smoke, smell of cigarettes and the strain it puts on a country's health service as a result of smokers developing diseases later in life such as lung cancer. It is the fact that the smoker underestimates the long run health problems they could face from smoking, which creates the over-consumption of the good.

Below is a diagram to show an example of a market for a demerit good:

It is important to consider that not all goods which create a negative externality can instantly be recognised as a demerit good. Because classing a good as a demerit good depends on the valued judgement of the consumer i.e. smokers may not class cigarette as a demerit good.

As these types of goods always create negative externalities the government will try to intervene in the market to either reduce or eliminate the externality and the dead weight loss triangle, increasing welfare in the process. The ability to implement these policies and more importantly the effectiveness of them depends on how large the externality in the market is. For some goods, the magnitude of the externality is greater than other goods and this means the level of government intervention needs to be larger as a result. For instance, in markets such as the drugs market, government impose outright bans on the good as the externality imposed on society is so large. However, if the negative externality is smaller, then the government can use an indirect tax or educational policies to internalise the externality. 


Deposit Insurance

Is a gurantee to savers that all or a fraction of their deposits will be reimbursed if a bank fails. This is funded by the taxpayer. This is put in place to ensure that destructive bank runs do not occur by ensuring that depositors do not have a marginal propensity to run. Therefore savers will feel confident that there savings are safe even if the bank is troubled. As of 2015 the Bank of England increased the protection of up to £1million on certain depsoits.


Deposits

Money placed into a financial intermediary for security and wealth generating purposes. This money gets placed into deposit accounts such as savings accounts and checking accounts. The placement of deposits allow banks to use these funds to lend to borrowers and that in turn allows banks to make their profits through the interest income channel.

Below is a diagram which highlights how banks act as an intermediary of funds between surplus units (total income exceeds total expenditure) and deficit units (total income exceeded by total expenditure). This is done by taking depostis from these savers and transferring them to borrowers through loans.


Depreciating exchange rate

A fall in the value (Exchange Rate) of a currency due to excess supply. This will result in lower export prices and higher import prices.


Depression

A sustained reduction in economic activity and GDP that lasts for a long period of time (typically 2 years or more) and leads to very high levels of unemployment e.g. the depression that followed the Wall St crash in 1929 lasted for 3 1/2 years and GDP fell by over 25% and the unemployment rate rose to 25%.

Deregulation

A form of government policy when existing regulations are loosened or removed to encourage supply or demand of a good or service.

Derived demand

When the demand for one good or service results in the demand for another good or service that is a necessary part of the production process.

Below is a set of diagrams to illustrate derived demand in a demand and supply framework. If there is an increase in demand for cars, then ultimately more cars need to be produced to meet the extra demand. However, more cars can only be made if more steel is made. So therefore similtaneously an increase in demand for cars will lead to an increase in demand for steel, as steel has demand derived from cars.


Determinant of demand

The factors that will determine the level of demand at a given price e.g. population.

Below is a list of factors that will cause the demand of a given product to change. If the price of substitute goods change this will change the demand for a product as consumers will always switch to the cheapest versions of a product. If the price of complementary goods change this will affect the demand for a product as consumers will always consume both complimentary goods together. Changes in real income will affect the demand of a good because the more income that consumers have available to them the mre goods they are likely to demand and consume. The persuasion of advetising and marketing campaigns can sway consumers towards purchasing goods. Finally a change in fashion, tastes and preferences can also affect demand for products, this often happens in the clothing industry when certain clothing items come back into fashion .


Determinant of supply

A factor that will determine the level of supply at a given price.

Below is a list of factors that will cause the supply of a given product to change. If the costs of production change this will change the supply because it will ultimately affect the cost at which firms can produce products at and therefore their profit margins will be affected. New technology being introduced can increase the producitvity and efficiency of the production process and this can lead to an increase in supply at a given price. Goevernment taxes and subsidies can affect the overall cost of producing a good. For instance if a subsidy is granted to a firm it will encourage them to produce more as it is now cheaper to produce. Finally external factors such as the change in climate can affect the amount of goods that can be produced particuarly in the agricultural market (primary sector).


Diminishability

An essential element of both a normal good and a private good. It means the consumption of a good or service by one consumer will diminish the amount available to another.

Direct tax

Taxes on income and wealth that diminish the amount of money available to buy goods and service e.g. income tax

Discount to par

Is a term that describes when a bond is being sold and traded at a discount price. When a bond is being traded at a discount (below par), its current yield is higher than the fixed coupon rate. This can happen for a variety of reasons but the most common is a rise in the interest rate which causes investors to switch to similar risk-related assets offering a greater return i.e. the excess supply of bonds forces the price to below par.


Discouraged workers

Unemployed workers that decide not to pursue re-employment. Sometimes referred to as workers that are marginally attached to the workforce i.e. of working age but not actively looking for a job.

Discretionary fiscal policy

Small adjustments to fiscal policy that are more likely to change the structure rater than the size of the economy. This is more likely to be motivated by political rather than economic factors.

Diseconomies of scale

A process which causes average costs to increase as output rises. It will occur when output rises above the level at which capacity is exceeded.

Below is a diagram to illustrate that as the size and scale of a firm and their output increases beyond an optimal point the firm inadvertently causes its own costs to rise. This is highlighted by the SRAC curves shifting up the LRAC as the scale of the firm increases. This shows that all firms have a capacity in which no more cost advantages are available i.e. increasing the scale and size of the firm has no beneficial effect on the firm e.g. a barber's shop in a small town.


Disequilibrium

When there is either an excess of demand or supply.

Below is set of diagrams to illustrate when an excess demand or supply can lead to a disequilibrium, as there is no longer a market price which causes the supply and demand to equalise.


Disinflation

A decrease in the rate of inflation for an economy over time. Disinflation occurs when the increase in the main price index of a country (e.g. UK CPI) slows down from the previous period is measured over.

This should not be confused with the term deflation. Because even if the inflation rate has slowed down from 2.2% to 1.5%, the general prices of everyday goods will still be increasing by 1.5% despite the lower figure.


Disposable income

The amount of income (including state benefits) in any period that remains after the deduction of direct taxes.

Dividends

The share of profits that is paid to shareholders.

Division of labour

Workers perform individual tasks that contribute to the production of the good or service. This means that a number of workers will work together to produce a unit of a good/service. This helps to achieve greater efficiency as workers specialise in a smaller number of tasks.

This ultimately helps to increase productivity because the longer workers can carry out jobs for, the more efficient and acustomed they become towards carrying out the task in the best possible way. This then ultimately will free up workers time to carry out other tasks.

This is all based on Adam Smith's theory of specialisation regarding workers in a pin factory.


Division-of-labour

Workers perform individual tasks that contribute to the production of the good or service. This means that a number of workers will work together to produce a unit of a good/service. This helps to achieve greater efficiency as workers specialise in a smaller number of tasks.

Dodd Frank Act - 2010

Passed as a response to the 2008 financial crisis, it brought the most significant changes to financial regulation in the US. Specifically it focused on ensuring that by 2019 all universal banks had ringfenced their commerical banking activities away from their investment banking activities.


Double Coincidence of Wants

For exchange to occur via barter, both parties must want the products being exchanged and the rate of exchange must be acceptable.


Durable goods

Goods that are not immediately consumed and can be used repeatedly, often over a long period of time e.g. pair of running shoes.

Dynamic efficiency

When a firm achieves productive efficiency over a sustained period of time.

Graphically this can be represented by the firms long-run average costs curves falling over time. This is achieved by the firm inventing and innovating new products and more importantly better and more efficient production processes. This type of efficiency will see both the short-run and long-run average cost curves fall over time.


Dynamic model

An economic model that considers a particular issue over a period of time.

Economic activity

Any behaviour or action that involves the supply and consumption of goods and services.

Economic agent

An individual, firm or government involved in the buying and selling of goods and services and making investments.

Economic Cost of Production

The opportunity cost of production.


Economic crisis

A prolonged period of depressed asset values and economic activity and high inflation and unemployment usually as a result of political instability, a war, government debt default or the collapse of a banking system.

Economic cycle

A term used to describe the process of economic expansion (positive output gap) and contraction (negative output gap) that economies experience over time.

Below is a depiction of the theoretical movement of a country's economic cycle. What this diagram is showing is that an economy typically moves from periods of growth, and this culminates in a boom (peak). After this the economy hits a downturn, as economic growth cannot be sustained. If the downturn is sustained for more than two quarters this creates an economic recession, in which the economy hits a trough (the lowest point of growth). Eventually an economy will arrest the decline in growth, as a result of economic policies, and this enables the economy to recover over time. After which, the whole economic cycle restarts.

It is important to appreciate that the depth and duration of cycles and phases within the cycle will vary considerably due to individual specifics within each country (as well as external influences) and therefore a country's economic cycle will not always match the smooth shape of the economic cycle above.


Economic Development

A broader measure than economic growth that considers changes in the standard of living and level of welfare within an economy.

Economic development unlike economic growth can be quantified using lots of different indicators. This is because there are many factors which contribute to a country's standard of living as the diagram below illustrates. The most commonly used measure is the level of nominal GDP per capita, to measure the material welfare and advanaces of the average household. But material expenditure power is not the only indicator of a country's standard of living. For instance the level of healthcare is important as this takes into account how easily this person can live their day-to-day life as well as maintaining a strong and healthy attitude towards work.


Economic efficiency

The extent to which markets produce the right goods (the combination of goods will be determined by the position on the PPF), in the right way (goods will be produced at lowest possible average cost) for the right people (market equilibrium output that fully reflects all costs and benefits).

Economic Efficiency can often be referred to Pareto Efficiency as this is the point where the optimal allocation/distribution of resources is i.e. there is no other outcome that can produce a better result.

When referring to economic efficiency it is concerned with how well scarce resources in the economy are being allocated in order to maximise social welfare by meeting the persistently changing needs and wants of economic agents in the economy. Typically, resources are allocated optimally if markets work well via the price mechanism.

Economic efficiency is achieved if firms within a market can achieve the following forms of efficiency:

  • Productive Efficiency
  • Allocative Efficiency
  • Dynamic Efficiency

But there are many situations where the market mechanism fails to allocate scarce resources optimally and as a result this creates a form of market failure which leads to social welfare becoming reduced. The factors that can lead to economic inefficiency in a market are as follows:

  • Lack of Competition -  in markets where there are a small number of firms present means that these firms do not have the incentive to continually invest and innovate in productive and profitable projects and therefore this causes their costs to increase over time(X-inefficiency). These higher costs eventually get passed onto consumers via higher prices. This occurs in markets such as a monopoly, where the profit maximising output level lies below that of which is socially optimal as a result of the higher prices. Therefore, consumers cannot consume as much of the good as under a competitive market structure (allocative inefficiency).
  • Presence of External Costs or Benefits - results in the private costs and benefits never equating the social costs and benefits through the market mechanism and this means that the quantity of goods and services produced by firms is either under-provided or over-provided. This occurs in markets where externalities are present such as demerit goods.
  • Missing Markets - another situation where the optimal allocation of resources is not met because of the lack of provision of these types of goods from private firms. Often it is the government's role to provide this type of good to the market, but often it ends up under-consumed because of the lack of acknowledgement towards the social benefits of consuming this type of good. Examples of this are public goods and merit goods.
  • Information Failure - efficient markets contain a consistent level of information across all firms and consumers and it is this that allows firms to provide the socially optimal amount of goods.
  • Factor Immobility - if factors are immobile (geographical and occupational immobility of labour) it makes it difficult to firms to achieve the socially desirable allocation of resources they might not be able to allocate enough factors required to each market.


Economic goods

Goods and services that are scarce because using resources for one purpose will mean that they cannot be used for another purpose i.e the use of most resources carry an opportunity cost. This is the opposite of a free good e.g. air.

Economic growth

An increase in the capacity of an economy to produce goods and services – measured by comparing GDP in different periods of time. Below is a table to illustarte the GDP growth rate for the UK from quarter to quarter from 2000 to 2015.

Economic growth is caused by increases in the productive capacity of an economy and is usually explained using AD/AS analysis. A key related definition is sustainable economic growth.

A good way of viewing economic growth is that:

  1. Positive shifts in AD will usually produce temporary economic growth and inflation i.e. unsustainable
  2. Positive shifts in LRAS will produce permanent and lasting economic growth with a minor impact on inflation i.e. sustainable 

Economic model

A hypothetical prediction of a particular aspect of economic activity that is based on empirical evidence.

Economic problem

There are insufficient resources to satisfy all of our needs and wants as resources are scarce while our wants and needs are unlimited.

Economic recovery

When an economy grows after a period of contraction.

Often these types of recoveries are stimulated by government policies e.g. an interest rate cut, a batch of quantitatitve easing, cut in taxation or higher government spending. All these policies aim to move the economy back towards full employment. Below is a diagram which highlight the effects that these types of policies can have on the economy in an AD-AS framework.


Economic theory

A hypothetical prediction of a particular aspect of economic activity that is based on empirical evidence.

Economic welfare

The overall standard of living and satisfaction within an economic system.


Economics

The study of the mechanisms that determine how we allocate resources to produce goods and services.

Economies of increased dimensions

Increasing the dimensions of any structure will lead to a proportionately larger increase in capacity. e.g. increasing the size of a box from 2m x 2m to 4m x 4m increases the surface area by a factor of 4 while the capacity increases by a factor of 8. This has the effect of reducing the storage costs per unit as scale rises.

Economies of massed resources

A firm operating equipment units or vehicles will have requirements for spare parts and expertise to maintain their equipment. As the total cost will be the same for a single or number of vehicles the average cost reduces as the number of equipment units increase.

Economies of scale

Economies of scale describes a process which causes average costs to reduce as scale increases. It will continue until output rises to a level at which capacity is fully utilised.

Below is a diagram to illustrate how economies of scale can be graphically represented for a firm. All average cost curves have a minimum point i.e. the level of output where average costs are minimised. The idea is that as the firm increases in scale the average cost curves begin to move down the LRAC curve and as a result the firm experiences lower costs as their output grows.

Economies of scale diagram

Teaching economies of scale to your students? Click here


Economies of vertically linked processes

As the scale of a firm increases it may diversify in to vertically linked processes (i.e. own the land, rear the cows, slaughter the cows and own a butchers). Owning and integrating the processes can achieve economies that help to reduce average costs as the firm increases in scale.

Effective demand

The quantity demanded at any particular price.

Effective supply

The quantity supplied at any particular price.

Elastic demand

When the percentage change in demand is greater than the percentage change in price. In this case the PED elasticity value will lie between 1 and infinity.

To identify the shape of an elastic linear demand curve we do not focus on the gradient of the curve as this does not actually determine elasticity. Crucially, it is the position of the demand curve that determines elasticity. This is because all linear demand curves contain portions on the curve which can be classed as elastic, inelastic and unit elastic. Any demand curve shown (like the one below) is just a section of a much larger demand curve that extends beyond the axis.

So effectively we can see that the midpoint of the demand curve is when unitary elasticity is achieved. The bottom half of the curve is inelastic, because if the price rises - at any point below the midpoint - expenditure increases despite a quantity fall. The top half of the curve is elastic, because if the prices rises - at any point above the midpoint - expenditure decreases due to a large quantity fall.

Therefore, the easiest way to determine an elastic demand curve is to extend the section of the demand curve drawn and identify which axis it intersects. If the demand curve intersects the y axis we can judge it as being an elastic demand curve as we must be focusing on the top half of the demand curve. An example of an elastic demand curve is shown below.

Below is a diagram to highlight the changes in expenditure that occurs when there is a small price rise. When a demand curve is relatively elastic, it means that consumers are sensitive to price changes. In this instance, a small price rise leads to a large fall in demand as consumers switch to alternative cheaper substitutes.


Elastic Supply

When the proportionate change in supply is greater than the proportionate change in price. In this case the PES value will be greater than 1.

Below is a diagram to show the characteristics of an elastic supply curve:

The supply curve has the typical upward sloping relationship between price and quantity supplied because of the greater profit incentives that are associated with higher prices. With an elastic supply curve firms have the ability to raise output quite significantly in response to a price rise and this is down to a few factors in the firms production process. 

These factors are:

1. Amount of Spare Capacity - The more spare capacity a firm has the greater their ability to raise output in line with prices. This is because they have the resources to do so given that they are producing below full capacity.

2. Length of Production Process - If a firm is producing a good which does not have a long production process they have the ability to respond to price changes by changing supply in line with short term price variations. 

3. Factor Substitutability - A firm will always wish to produce the good that has the highest price, as this is the good that will yield the highest level of profit. If firms are able to transfer their factors of production towards different production processes, they have the ability to increase output in line with prices.


Elasticity

A method for measuring the relationship between the value of 2 variables by dividing the proportionate change in the dependent variable (Q) by the proportionate change in the independent variable (P).

Elasticity of Demand

Is an elasticity measure that is used in economics to identify the responsiveness of quantity demanded to changes in price. These measures can become very useful evaluative tools when structuring an exam answer to a data response question. This is because the impact of demand and supply curve shifts on the market equilibrium will depend on the position and slope of these demand curves and that is determined by the elasticity values of the good.

When referring to elasticity measures that relate to demand, there are three that will aid the evaluation of an exam answer:

PED = Price Elasticity of Demand

YED = Income Elasticity of Demand

XED = Cross Elasticity of Demand 

Out of these elasticity measures PED provides the most intuitive analysis when evaluating the demand curve of a particular good.  Using PED as an elasticity measure we can define a good's demand as:

Inelastic Demand

Elastic Demand

Unitary Elastic Demand

Perfectly Inelastic Demand

Perfectly Elastic Demand

PED is a useful and effective concept when evaluating supply curve shifts, as the impact on the price and quantity demanded will depend on the elasticity of the demand curve for a good. For instance, if a demand curve is inelastic then when there is a supply curve shift it exacerbates the impact on price, but the impact on quantity is muted. This is because the inelastic demand curve relates to goods in which consumers are not price sensitive, despite the magnitude of the price change. This is often the case in markets which provide goods which are necessities to consume, such as agricultural products. Below is an example of how the elasticity of the demand curve in a market impacts changes in the market equilibrium:

In this case, there is an inwards supply curve shift and this creates pressure for prices to increase to P1 as a result of excess demand. This is the case regardless of the elasticity of the demand curve. However, as is shown in the diagrams, the more inelastic the demand curve the greater the price increase in the market. The opposite process would occur if the supply curve would outwardly shift. 

This demonstrates that elasticity is a powerful evaluative tool when analysing changes in demand/supply curves and forms a crucial part in describing the chain of economic events that unfold in these types of markets.


Elasticity of supply

An elasticity measure to measure the responsiveness of the quantity supplied by firms to changes in prices. These measures can become very useful evaluative tools when structuring an exam answer. to a data response question. This is because the impact of demand and supply curve shifts on the market equilibrium will depend on the position and slope of the supply curves and that is determined by the elasticity values of the good. 

To measure the elasticity of supply curves we use the Price elasticity of supply measure, as this provides intuitive analysis when evaluating the supply curve of a particular good. Using PES as an elasticity measure we can define a goods supply as having:

Elastic Supply

Inelastic Supply

Unit Elastic Supply

Perfectly Elastic Supply

Perfectly Inelastic Supply 

PES is a particularly useful and effective concept when evaluating demand curve shifts, as the impact on price and quantity will depend on the elasticity of the supply curve for the good. For instance, if a supply curve is inelastic then when there is a demand curve shift it will exacerbate the impact on price, but the impact on quantity will be muted. This is because when firms face an inelastic supply curve they are unable to change supply in line with price changes in the traditional way. This may be down to a number of different factors which restrict firms ability to change output. Below is an example of how the elasticity of the supply curve impacts the changes in the economic variables following an inwards demand curve shift.

In this case, there is an inwards demand curve shift and this creates pressure for the price to fall to P1 as a result of excess supply. This is the case regardless of the elasticity of the supply curve. However, as is shown in the diagrams, the more inelastic the supply curve the greater the price fall in the market. The opposite process would occur if the demand curve outwardly shifts. 

So this demonstrates that elasticity is a powerful evaluative tool when analysing changes in demand/supply curves and forms a crucial part in describing the chain of economic events that unfold in these types of markets.


Elasticity values

Values which represent the degree of elasticity for a particular good.


Emission permit

Government issued permits authorising carbon emissions up to a certain level. They are often traded with efficient firms selling unused emissions to inefficient firms that need to exceed their emission permit to meet demand.

Empirical research

Research that informs theories by observing, measuring and analysing actual events.

Employment

When labour is engaged in the productive process in return for wages.

Enterprise

The factor that organises production. It provides the entrepreneurial/ management expertise that organises factors of production to earn profits.

Entrepreneurial

A behaviour that leads people to take the risk of establishing a business to earn profits.

Equilibrium

When there is no momentum for anything to change, This occurs when the market price is stable because the quantity demanded is equal to the quantity supplied.


Equilibrium Concept

Is the term used in game theory for the predicted optimal solution to a game.


Equity

In economics this concerns how fairly resources are distributed among economic agents.

Equity Capital

Money that has been invested, in contrast to debt capital, which is not repaid to the investors within a fixed period of time. The fund provider instead receives a percentage of the ownership as well as future company profits. These funds can then be used to act as a buffer stock to absorb any losses companies or banks make.

Below is an example of a balance sheet for a bank and the role that capital can play in a bank. In this instance the bank has £8bn worth of capital to absorb any losses that bank may make specifically concerning non-performing loans. So as long as the bank can maintain their losses below £8bn it will always remain in a solvent position on the balance sheet - this is the main objective for many banks to ensure confidence in the bank from customers and regulators. However, if the losses exceed £8bn then the bank does not have capital to neutralise the losses and therefore becomes insolvent i.e. liabilities outstrip assets.


EU

An economic and political union of 28 countries in Europe that has established a single market by applying standard laws across all member countries - The European Union.

European Union

An economic and political union consisting of 28 member states within the geographical boundaries of Europe. The union was formed to create a single economic area/market in which the free movement of goods, services, labour and capital takes place.

For countries to become part of the European Union the adoption of the Euro (single currency) is not necessary, as certain countries operate within the union but are not part of the Eurozone, as a result of the constricting one size fits all policies they have to take on in the process.

The Union was established as a result of the passing of the Maastricht Treaty in 1991 (established the timeline associated with the formation of the union and its member states) and since then membership has been open to countries that can meet the specific criteria of becoming a member such as: being run by a democratic government, maintaining a good human rights record and a tendency to implement sound economic policies. 

The European Union is organised and controlled by a number of important institutions, these are:

  • European Commission - The executive body of the EU and responsible for proposing legislation and policies as well as identifying new policies for the single market.
  • European Council - A council that comprises the heads of state or government representatives of the member states. This council has the role of voting on the policies that have been proposed by the European Commission and often this vote needs to be unanimous for the policy to follow through. 
  • European Parliament - This is composed of directly elected representatives, more commonly referred to as MEPs (Members of European Parliament). The parliament stands for MEPs to give their stance of economic policies and in particular the performance of the European Commission. 
  • European Court of Justice - Sets and makes judgements on EU laws currently in place, these judgements have wider impacts on the member states. 

These four institutions come together to ensure that freedom, justice and security is maintained across the entire union, whilst simultaneously creating the ideal political conditions for promoting economic and social progress in each country. In the process, this not only asserts each country's influence and role on the world stage (e.g. trade) but also Europe's role in the world. However, eurosceptic criticism has always been attached to these types of institutions, as some of the representatives are unelected and therefore hold no accountability for their actions.

Whether union membership is beneficial for a country or not all depends on the relative merits or demerits of union membership for that particular country and this all depends on the individual specifics of the country involved. 

However, in theory the benefits of a country being part of the single market are:

  1. Trade Creation - By becoming part of the single market, member states benefit from increased trade as a result of trade barriers such as tariffs being removed. The fact that trade barriers are removed creates the incentive for countries to begin specialising in the production of certain goods and services and reap the benefits of economies of scale. The increased trade leads to wider economic advantages for economic agents such as prices become reduced and an increase in economic activity which fuels higher jobs within a country e.g. the UK's financial services industry.
  2. Stable Economic Conditions - By becoming part of union the country is likely to benefit from the fact that political and economic certainty is achieved across all union members and this makes it easier for domestic businesses to sell their products to other union members, as all countries have to adhere to the same product standards. If firms feel more comfortable and certain with the conditions they face, it is likely to encourage them to take on new staff and engage in investment projects. 
  3. Migration Benefits - The free movement of labour allows firms to take on workers where domestic skills shortages may be present. Without the ability for countries to plug these gaps it may hold back their productivity and efficiency and therefore businesses may struggle to operate. 

The costs of becoming part of the single market are:

  1. Membership Cost - EU membership requires an annual fee, which could be diverted towards domestic expenditure areas such as healthcare and education.
  2. Regulations - Becoming part of the EU means all member states have to abide and respect all regulations set by the European Commission and this can be very damaging for certain economies which may become restrained by the excessive regulation. This is caused because EU regulation affects all member states rather than specific states.
  3. High Immigration - For certain member states, high net migration can be problematic as it increases the supply of labour for a country without accompanying increases in demand for labour. This can progressively drive down wages for domestic workers and discourage certain domestic workers out of searching for jobs. Increasing the benefit payments that governments have to pay. 

Now when it comes to evaluating European Union membership for specific countries such as the UK, you need to go further than just listing the costs and benefits against each other as this is just a form of analysis of EU membership. It is important to consider how large each cost and benefit is for a country and in particular which costs and benefits are important for each country. Considering these points allows candidates to create a more balanced and reasoned argument towards EU membership 

Some of the key evaluation points you could mention are:

  • Is the EU membership fee as extravagant as perceived when compared to national government figures? e.g. the national debt for a country.
  • If EU regulation was removed,  would a national government be better placed to decide upon the optimal regulation strategy for a country going forward? e.g. government failure and independence issues?
  • The uncertainty of leaving a single market can create uncertainty but will this be sustained in the long-run? e.g. once trade deals have been established uncertainty would disappear over time.
  • Are EU immigrants always more-suited to UK jobs when compared to domestic residents or even non-EU immigrants? e.g. all depends on the skill levels of immigrants and whether that skill set is valued in that particular country.

Evaluation

Economics is an uncertain science. What causes the real economy to change, how significant the changes are, how quickly they occur and how long they last for cannot be predicted with any certainty.

While economists might be able to accurately generalise whether a variable (e.g. price) is likely to rise or fall in response to a change in another variable (e.g. demand or supply), most will agree that it is almost impossible to know how large the change will be, how long it will take to emerge and how long the change will last for.

They will also recognise that although the assumption of ceteris paribus makes economic analysis easier, the real world does not reflect ceteris paribus and this nearly always means that changes in other variables will conceal or counteract the expected changes so that it seems like they didn't actually happen.

These uncertainties define what evaluation is and what students need to do in exams to convince examination markers that they have adequately demonstrated this skill.

A good way of working with this in exams is to start your answer with a ceteris paribus assumption so that you can clearly analyse the general changes you are considering and then evaluate this analysis by explaining that you understand the uncertainties attaching to the precise outcome (low level evaluation) and then identify some of the other factors that might result in a more or less significant or completely different outcome to the outcome your analysis predicts.

A really simple way of looking at this is that whenever a student analyses a chain of economic events it is crucial to clearly articulate any uncertain aspects relating to the outcome their analysis has predicted.

In an AS micro exam a simple and straightforward question might ask you to explain and evaluate why an increase in car sales might contribute to a rise in the price of oil.

Start with analysis and make sure you use a graph, label it accurately and explain all the steps involved stating with the initial equilibrium position and explain how the market transitions to the new equilibrium position.

microevaluationA

These diagrams illustrate the market for oil and some of the possible outcomes. Analysis should start with creating a graph like the one titled normal outcome followed by an explanation.

The market is initially in equilibrium at a price of P (step 1) where the quantity demanded and quantity supplied equal each other at Q (step 2). Due to the increase in the demand for oil due to a rise in car ownership (step 3) the demand for oil shifts outwards from D to D1 (step 4) this is because cars and oil are an example of joint demand (step 5). The initial shift creates excess demand (step 6) and this drives prices higher over time (step 7) until equilibrium is re-established at P1 Q1 (step 8).

To access higher grades you will need to evaluate your analysis:

Although the price of oil is expected to rise there is always uncertainty concerning how much and how quickly the price rise will materialise. For example, a small change taking some time to materialise may have limited impact on the price of oil (see small shift) while a large and rapid increase in car ownership could have a dramatic and more immediate impact on oil prices (see large shift).

You could develop this with some more detailed analysis and evaluation (this is the key to obtaining the highest grades). The timing and size of the changes will depend on a couple of factors:

  1. As the demand and supply of oil is relatively inelastic the changes in price are likely to be greater than the changes in output. There is an opportunity for further analysis here as you could draw an additional graph depicting inelastic demand and supply to illustrate the differential between price and quantity changes. You could also explain why the demand (oil is a necessity) and supply (it takes a long time to develop new oil fields) are inelastic (see difference between elastic and inelastic s/d).
  2. If the changes in car ownership take place over a relatively long period of time the impact on oil prices could be offset by suppliers recognising this change and increasing oil supply. This might have the potential to result in a downward movement in price as has been evident over the last 18 months (see supply responds over time).

You will notice that the are many terms used in this explanation (definitions are shown in the various light boxes). In an exam you should aim to define some of these terms.


Excess demand

When the quantity customers want to buy exceeds the quantity firms are able to supply. This is resolved when firms increase prices to reduce the excess demand. This encourages supply and discourages demand until the excess is removed.

Below is a diagram to illustrate how excess demand occurs in a market. Any factor which causes an increase in demand without accompanying changes in supply will create excess demand and prices have to rise in order to maintain equilibrium.


Excess supply

When the quantity firms supply is greater than the quantity customers want to buy. This is resolved when firms reduce prices to sell off excess supply. Lower prices discourage supply and encourage demand until the excess is removed.

Below is a diagram to illustrate how excess supply arises in a market. In this instance an increase in supply without an accompanying increase in demand will lead to supply exceeding demand and this causes the price to fall to P1 in order for the equilibrium to be restored.


Exchange

An essential element in the development of economies. It enables progression from self sufficiency to trading. In under developed economies this is enabled by barter. As economies develop and grow, barter will be replaced by a system of money as the main medium of exchange.

Exchange rates

This is the price of a currency expressed in terms of another currency e.g. £1 will buy $1.65.

The diagram illustrates how an exchange rate is determined by the demand (generated by exports because foreign countries need the currency to purchase the domestic country's exports) and supply of the home currency (this happens because the domestic currency is supplied to acquire foreign currencies so that imports can be purchased) on the foreign exchange market. Demand and supply is generated by financial as well as physical transactions.

In this example at the point where Qd = Qs the exchange rate is ER. In modern times circa $5 trillion is traded every 24 hours. This means any imbalances in demand and supply produce almost immediate exchange rate adjustments so that the market continuously clears. As a result exchange rates are quite volatile and adjust quickly to changes in demand and supply. It should be appreciated that the majority of foreign currency transactions relate to financial transactions (approx 2/3) rather than trade in goods and services. 


Excludability

Is an essential element of a normal market as it prevents free rider activity. When consumers buy a good or service they usually acquire private property rights which means that other people are excluded from using or benefiting from consumption of the good.

Expansionary fiscal policy

Changes in taxation or expenditure that are designed to inject demand into the economy.

Below are a set of graphs to show the impact of the government running an expansionary fiscal policy on the economy in an AD/AS framework. This is done through cutting taxes, increasing government expenditure or possibly both from the classical viewpoint. Regardless of whether the economy has spare capacity or not he impact of the policy is to shift the aggregate demand curve outwards to AD2.

However, what is important when evaluating the effects of an expansionary fiscal policy is to take into account the amount of spare capacity in the economy at the time. The greater the degree of spare capacity, the more effective and the less inflationary the policy is. In the case below, when an economy has significant spare capacity, an expansionary fiscal policy shifts the aggregate demand curve outwards , as a result of spare resources in the economy being available this creates little pressure for the inflation rate to accelerate. Therefore, the final impact on the economy is to achieve short-run growth - whether that is sustained in the long-run depends on what sectors of the economy the fiscal policy targeted. This is the Keynesian viewpoint of demand side fiscal policies such as this one - creates growth without inflationary pressures due to the presence of spare capacity in the economy.

However, an alternative viewpoint could be that if the economy is at full capacity then a policy that aims to inject economic activity and demand into the economy could cause the economy to overheat and create significant inflationary pressures in the process, without the benefits of higher economic growth. So effectively in the long-run we are just moving up the LRAS curve. This tends to be the classical viewpoint on these types of policies - unless there is an accompanying LRAS curve shift then effectively the policy just becomes inflationary. 


Expenditure

The amount of money spent on goods and services in the economy at a particular point in time.

Below illustrates how to calculate the total level of expenditure via adding up all the seperate components i.e. consumption, investment, government spending and net exports (exports - imports).


Exports

UK goods that are sold to other countries - any transaction that generates a positive monetary flow into the UK e.g. Land Rover cars sold abroad or foreign money flowing into the UK financial services industry.

Below is a diagram to show that exports represent an injection into a country's circular flow of income as it is money from other countries being spent on domestically produced goods.

Therefore exports contribute to the aggregate demand curve and if exports increase due to a weaker pound sterling then it will cause the AD curve to shift outwards as shown in the diagram below.


External benefit

Benefits arising from the consumption of a good or service that is experienced by third parties.

External consultants

Firms that specialise and develop expert knowledge in specific areas to provide specialist advice and services to firms, businesses and governments

External cost

Costs arising from the production of a good or service that are imposed on third parties.

External Economies of Scale

Decreasing average costs due to the positive externalities of an industry or economy growing in size.

Below shows the effects of this type of economies of scale on a firm's long-run average cost curve. For instance the development of infrastructure or the benefits of an expanded local supply network may lead to lower average costs.


External economies/diseconomies

Economies and diseconomies of scale that arise because of the growth of the market as opposed to the firm.

External Growth

External growth is the rate of growth of business, sales expansion by increasing output and business reach by acquiring new businesses by way of mergers, acquisitions and take-overs.

As the diagram shows below there are three different variants of external growth: horizontal integration, vertical integration and conglomerate integration.


External tariff

A tax on goods imported from other countires.

Externalities

Costs arising from production or benefits arising from consumption  that are experienced by third parties and are not reflected in the price and output level determined by the market.


Externality

Is a cost/benefit that is imposed on third parties i.e. economic agents who were not involved directly in the production/consumption of the good.

The presence of an externality in a market signals market failure and therefore society's welfare is not being maximised. 

There are four different forms of externalities that can arise in an economy:

  • Negative Production Externalities
  • Positive Production Externalities
  • Negative Consumption Externalities
  • Positive Consumption Externalities

Factor mobility

The ease with which factors of production can be switched between different productive processes. This determines how flexible an economy is. The extent to which a factor can be physically relocated and how easily it can be applied to a different productive process will have a big influence on factor mobility.

Factor of production

An input that is used in the production process i.e. land, labour, capital and enterprise.


Factors of production

The inputs that are used in the production process to facilitate the production of the goods and services which contribute to an economy's GDP. An input can be classified as either labour, capital, land or enterprise, depending on the function that the input serves in the production process. A summary of the main characteristics of the four factors of production are highlighted in the table below.

  • Labour represents the mental and physical human input into the production process. Therefore the quantity (size of the workforce) and quality (productivity of workforce) of labour affects the importance of labour in the production process of any good or service. Factors such as increased education and training and an increase in migration levels can result in an increase in output of an economy's resources. Workers receive a wage based on their productivity and monetary value to a company at any particular point in time i.e. for every hour of labour supplied by workers this is in return for an hourly wage rate.
  • Land represents all of the natural resources a country is endowed with such as the land or the sea. However, it also includes all of the resources which can be extracted and cultivated from those natural resources such as agricultural products from farms. Developing countries are often land abundant (large endowment of natural resources) and therefore specialise and rely upon the agricultural sector for economic growth. The reward for land is rent as landowners rent the land out to producers across the economy.
  • Capital represents the goods which are used in the production process to help produce the final product. It is made up of two different forms of capital: working capital and fixed capital. Fixed capital represents the machinery, technology, and buildings which are used to help produce the final goods and services. Working capital represents the day-to-day capital used to help produce goods in the future, this can include cash or the stock of unfinished inventories. Capital owners receive a reward of interest as producers increase their capital stock by taking out loans and borrowing from the private sector. Therefore, interest represents the opportunity cost of borrowing for firms and the reward for owners of each unit of capital.
  • Enterprise represents the individuals that help organise the complex mix of factors of production in the production process of any good or service so that a profit is made as a result. Examples of enterprise may include managers or investors that take risks in the company with their own money to gain a share of higher profits in the future.

Financial account

Records the capital transfers made by individuals moving between countries and by Governments due to support provided to other countries. The amounts recorded are small relative to the current and capital account.


Financial Conduct Authority (FCA)

Aims to protect consumers, promote greater competition and ensure a stable financial environment.


Below represents the current 'twin peaks' regulatory structure of the financial sector with the FCA being a subsidary of the Bank of England.


Financial Crisis

Is when there is a situation in the financial system in which financial assets suddenly lose a large part of their nominal value. One of the most common ways a financial crisis can start is from a bank run/panic causing the failure of a healthy bank and suddenly this stems a recession and full financial problems for the economy. This is often called a twin or triple crisis.


Financial economies

As firms grow in size they will gain access to more sources of finance and improved terms.

Financial institutions

Are financial intermediaries providing financial services such as deposit taking, credit provision, insurance cover, pension schemes and investment funds e.g. banks, insurance companies, asset managers, hedge funds and private equity funds. They facilitate the link between savers and borrowers.

Financial Markets

Organise the issue and trade of shares, bonds and commodities. Liquidity in these markets is provided by real time adjustment of prices to match buyers and sellers. Financial markets can be divided up into 3 seperate markets: Money Markets, Capital Markets and Foreign Exchange Markets.

Below is a breakdown of the types of financial markets that economic agents have access to in order to secure finance.


Financial Policy Committee (FPC)

Setup to identify and take action to remove or reduce systemic risks, with a view to protecting and enhancing the resilience of the UK financial system.


Below is an illustration of the 'twin peaks' regulatory structure for the UK financial sector with the FPC acting alongside the Bank of England to ensure systemic stability.


Financial Services Authority (FSA)

Responsible for the regulation of the financial services industry in the United Kingdom between 2001 and 2013. Its board was appointed by the HM Treasury, although it operated independently of government. It has later been replaced by the Bank of England and the Twin Peaks regulatory structure.

Below is an illustration of the old regulatory structure brought through by Gordon Brown, where the FSA were in sole control of regulation and supervision.


Finite resource

A resource which is scarce as it is fixed in supply and will eventually run out if it is used continuously.

First Degree Price Discrimination

when a firm decides to charge a different price for every unit consumed and by doing so can charge the maximum possible price for each unit it sells. This allows them to capture all the consumer surplus under the demand curve and to be able to convert it into producer surplus. This type of price discrimination is also commonly referred to as perfect price discrimination as it requires perfect knowledge of individuals valuations of goods. Therefore this type of price discrimination is quite rare.

Below highlights a breakdown of how a firm tries to perfectly extract as much consumer surplus away from the market to convert into producer surplus by charging each consumer their maximum valuation, as a result there is no consumer surplus left over as the demand and supply diagram shows below.


Fiscal Multiplier

The economic impact of fiscal initiatives . This value is likely to be close to 1 or even less than 1 due to the negative impact of raising tax revenue to fund initiatives.

Fiscal policy

Changes to taxes, government spending and borrowing that aim to influence the level of economic activity in order for the government to achieve the main macroeconomic objectives.

The policy works by the government changing the level of taxation and government spending over a period of time and the fiscal stance that the government decides to take all depends on the state of the economy at the time. For instance, during a recession an economy is stimulated via higher spending/lower taxes in order to inject demand and economic activity into the economy. Whereas during a boom, spending is reduced/taxes raised to help control inflationary pressures that have arisen and also governments use this period to help pay back any past borrowings which fuelled previous budget deficits i.e. national debt. 

There are two different types of fiscal policy that the government can implement:

  • Expansionary Fiscal Policy - stimulates aggregate demand (injections)
  • Contractionary Fiscal Policy - restricts aggregate demand (leakages)

The impact of these policies on the main macroeconomic variables are shown below assuming ceteris paribus.

It is important to note that fiscal policies are often used alongside monetary policies, as fiscal policies should not be predominantly used to control prices as this is the role of monetary policy. 

However, it is important to note that the long-run impact of a fiscal policy all depends on the sectors of the economy that the policy has targeted. For instance, if an expansionary fiscal policy is run, it predominantly increase spending by the government into the public sector. If that spending has been directed to areas of the economy with strong productivity links (e.g. education, health or transport) then productivity gains will be large and ultimately this will create an accompanying LRAS curve shift in the long run, creating dis-inflationary growth. However, if it is targeted to areas with tenuous links to productivity then it is unlikely to significantly change the position of the LRAS curve and the end result will just create inflationary pressures without growth. 

From a policymakers perspective, the desired outcome of fiscal policies is to direct spending to those productive areas of the economy to instigate the LRAS shift. This desired outcome of dis-inflationary growth is shown below from both the Classical and Keynesian perspectives.

However, as with all economic policies it is not an exact science. This is the theoretical outcome of an expansionary fiscal policy on real output and the price level but the impact seen on the economy in reality may take a different form, as a result of a few factors. 

Firstly, it is important to consider the impact of the multiplier effect on these shifts, as the larger the multiplier effect the greater the initial impact on AD. This is important for the government to consider because if the multiplier effects is large then perhaps they can increase spending by a smaller amount originally to get the desired AD curve shift. However, the size of the multiplier effect (positive or negative) can become diluted by the presence of automatic stabilisers, which can end up limiting the effectiveness of fiscal policies.

Secondly, if a government decides to increase spending then this can create resource and financial crowding out effects in the economy. This is because if the government increases spending into the public sector, this will ultimately lead to the public sector to expand. This could potentially be a problem if the economy is at full capacity because at full capacity the economy's resources are being fully utilised, so therefore to increase the size of the public sector, resources must be transferred from the private sector to the public sector, which subsequently shrinks the private sector. This is often interpreted as a problem because the private sector is profit maximising and is the sector of the economy that is the most efficient. This perhaps explains why expansionary fiscal policies are used only when the economy has spare capacity, so this crowding out effect does not happen.

Finally, when governments run budget deficits that have to fund that deficit by borrowing, but ultimately that debt has to be repaid back with interest. So it may well be that the AD curve shift is muted compared to theoretically anticipated. This is because if the government runs up a deficit via lower taxes, then this might not encourage consumers and businesses to spend and invest, if they anticipate that higher taxes will be introduced in the future to repay these debts off. It might well be the case that consumers save the tax break today in order to pay of future tax increases. It could be evaluated that this might not make much of a difference if the budget deficit is created by higher spending with a sizable multiplier effect.


Fixed capital

The premises, equipment or infrastructure used in the production process. It is not directly converted into goods or services in the way that working capital is.


Fixed costs

Production costs that do not vary in line with the number of units produced e.g. the acquisition cost of capital equipment.

Below is a list of some of the types of fixed costs that firms have to pay. For instance all businesses have to pay rent for the offices and factories that they work in. This cost is fixed because a contract is agreed and they have to pay a fixed amount of rent each month. This is the same for loan repayments or salary payments to employees.


Fixed Exchange Rate

Where the central bank intervenes in foreign currency markets and alters the level of currency demand and supply to maintain the exchange rate at a specific level. It does this by buying and selling up foreign currency reserves.

Below is a diagram to show how a central bank prevents the exchange rate from moving above its target level to a higher free floating equilibrium. There is upward pressure brought about by an increase in the demand for the domestic currency due to an increase in demand for exports, this creates an excess demand for the currency as shown below. To prevent the exchange rate from rising above the fixed rate the central bank prints more money to increase the supply of money and devalue the currency to offset the upward pressure. This new money is sold to acquire new foreign reserves, so that the foreign currency gets stronger and the domestic currency gets weaker. This downward pressure is enough to offset the upward pressure to maintain the fixed rate.

Below is a diagram to show how a central bank prevents the exchange rate fom moving below its target level to a lower free floating equilibrium. There is downward pressure brought about by an increase in the demand for the foreign currency due to an increae in demand for imports, this creates an excess supply for the domestic currency because when consumers buy foreign imports, they sell domestic currency to buy up foreign currency as the foreign imports are priced in terms of foreign currency. To prevent the exchange rate from falling below the fixed rate the central bank sells foreign currency reserves to buy up domestic currency, which increases the demand for domestic currency and creates upward pressure. By strengthening the domestic currency and weakening the foreign currency the downward pressure is offset and as a result the exchange rate remains at its fixed value.


Floating Exchange Rate

This is a type of exchange rate in which the price of one currency in terms of another currency is determined solely by market forces and is not influenced by direct intervention by central banks.

Below is an example of a market in which the exchange rate has been determined at a value that makes the demand and supply for pounds equate each other.


Flow

A flow variable is measured over an interval of time. For example, UK nominal GDP refers to the total number of pounds spent over a time period, such as a year. Therefore it is a flow variable, and has units of pounds/year.

Below highlights the idea of a flow in contrast to a stock. This shows that Real GDP is continually changing and this then gets added to the stock of real GDP to measure the size of an economy. In this instance the cumulative real GDP exceeds the current value of real GDP.


Foreign Direct Investment

An investment made by an overseas business (not investment funds) into a company in another country. This generates a positive cash flow into the country receiving the investment. For the purpose of national trade accounts investments must acquire at least 10% of a company to be categorised as foreign direct investment.

Foreign Exchange Market

The market where currencies around the world are readily bought and sold at a price determined by the market i.e. the exchange rate. This is one of the main financial markets.


Forward Contract

A contract that buys the right to trade at a given exchange rate at a specified date in the future. These contracts help eliminate foreign exchange risk and currency uncertainty in planned transactions.


Framing

A concept that says the presentation or context in which a choice is placed affects people's decisions. For instance a gym membership offering an annual payment of £480 a year is likely to be not as well received compared to if it was advertised at just the equivalent of £1.32 a day. This is why a lot of big ticket purchases such as phones and cars are paid in installements as most consumers either cannot or will not pay this extortionate price.


Free Good

Is a good that is not scarce, and therefore is available without limits. A free good is available in as great a quantity as desired with zero opportunity cost to society. It's important to note a good that is made available at zero price is not necessarily a free good. For example, a shop might give away its stock for free, but producing these goods would still have required the use of scarce resources. An example of a free good would be air.


Free goods

A good that is not associated with any opportunity cost as they are unlimited in supply, do not cost anything to produce and are freely available e.g. air.

Free market economists

Believe that there should be no government intervention as the forces of demand and supply will achieve more efficient outcomes in the long run.

Free Marketeer

A policy perspective that argues that government intervention should be strictly prohibited, on the grounds that it creates an inefficient allocation of resources.

Free market policies ensure the freedom of buyers and sellers to make their own decisions about producing, selling and buying products and services. As a result of these policies it leads to the LRAS curve shifting 

The type of free market policies include:

  • Deregulation
  • Privatisation
  • FDI
  • Free Trade
  • Export-Led Growth

The resulting impact of a free market policy is for the LRAS curve to shift to the right and this reduces inflationary pressures in the economy, whilst expanding real output. This is shown below


Free rider

A person that is able to consume a good without actually purchasing it e.g. flood defences

Free riders

Individuals that are able to consume a good without actually purchasing it e.g. flood defences

Frictional unemployment

The type of unemployment that measures the time period between jobs when economic agents are searching for jobs or in the process of moving to another job. Another term for this is search unemployment

Below is a diagram to illustrate the effects of frictional unemployment on an economy in a AD-AS framework. In this instance an increase in frictional unemployment reduces the pool of labour available for firms to hire and this pushes up the wages of existing workers as the labour market tightens and workers become more valuable in the employer's eyes. This then causes the SRAS curve to shift inwards as firms have to cut production with a lack of employment. But because frictional unemployment is often a form of short-term employment these effects are soon reversed and the economy moves back to its original position.


Full capacity

This is the maximum level of output sustainable in the long run given the current quantity and quality of productive resources.

Below shows an example of a country's PPF and as they are operating on the PPF they are at full capacity as no slack in the economy exists i.e. all resources and factors of production are being fully utilised.


Full employment

The level of output where all available factors of production are being fully utilised.

Below is a diagram that shows when an economy is in equilibrium and no output gaps exist and the economy is positioned at the full employment output level. Any output level beyond the full employment level introduces inflationary pressures into the economy, because unless there is an outward shift in the LRAS curve, then there are too few resources to produce too many goods. Likewise if the output level falls below the full employment level then this will introduce deflationary pressures into the economy as now there are too many resources to produce the amount of goods and services required.


Gambler's Fallacy

Is the mistaken belief that, if something happens more frequently than normal during some period, it will happen less frequently in the future, or that, if something happens less frequently than normal during some period, it will happen more frequently in the future.

The reason why it is called the gambler's fallacy is that often individuals fall for the this mistake when gambling. For instance many individuals believe that if they are flipping a coin and the previous ten flips all landed on heads, then there is a greater than 50% chance of a tails popping up in the eleventh flip. But of course, this is incorrect because each flip of a coin is independant from the last one so the history of flips has no influence on the next flip. The same logic can be applied to a roulette wheel.


Game Theory

The study of strategic decision making by using mathematical models to illustrate the conflict and cooperation between rational decision makers (players). It is a useful concept to be able to predict the equilibrium condition for interdependant decision making.


Game-Theoretic Situation

Is a situation where player's in a game do have to take into account the reactions of rival firms when setting their own strategic variable i.e. high level of interdependency between firms. Therefore firms need to reason strategically and form expectations about others' decisions when deciding their own course of action. These situations can be predicted and solved using game theory.

Below highlights three examples of firms in which would be classed a game theoretic situation i.e. rivals in the UK supermarket industry have to consider the pricing strategies of rivals and therefore game theory is a useful concept to analyse these types of situations. The most common examples of this are markets that are charactrised by a high degree of interdependency such as oligopolies.


General model

An economic model that explains economic activity using a wide range of variables.

Giffen good

A good where a rise in price actually leads to an increase in demand.

Below is a diagram to illustrate the good's demand curve. In this instance the curve has a positive slope and therefore is upward sloping due to the positive relationship between the two variables: price and quantity demanded. It is extremely rare for a good to have this positive relationship between price and quantity demanded and in most cases is just an empirical theory rather than a form of relatiy. But on example of a giffen good in the real world is basic food stapes in times of economic crises. The idea is that if an individual/family is struggiling financially and the price of the basic food essentials increase, these individuals end up purchasing more of this essential food item as they can't afford more expensive food items in its place despite the price of the essential good.


Giffen goods

A good where a rise in price actually leads to an increase in demand.

Below is a diagram to illustrate the good's demand curve. In this instance the curve has a positive slope and therefore is upward sloping due to the positive relationship between the two variables: price and quantity demanded. It is extremely rare for a good to have this positive relationship between price and quantity demanded and in most cases is just an empirical theory rather than a form of relatiy. But on example of a giffen good in the real world is basic food stapes in times of economic crises. The idea is that if an individual/family is struggiling financially and the price of the basic food essentials increase, these individuals end up purchasing more of this essential food item as they can't afford more expensive food items in its place despite the price of the essential good.


Gilt Edged Security

A contract issued by the Government in return for a loan (from individuals or institutions) which entitles the holder to fixed annual interest payments (coupons) for the duration of the loan and to repayment of the loan at the end of the contract period. They are called gilt edged as the government originally issued paper notes with gilded edges to confirm ownership.

Gilt yield

The cash value of annual gilt coupon payments divided by the market value of the gilt. The yield varies over time in line with changes in the market value of the gilt (this changes continuously in response to changes in market demand and supply). The current yield of existing gilts at any time will determine the rate at which governments may borrow new money.

Gini Coefficient

A statistical measure of the level of income inequality in an economy calculated by analysing the size of any inflexion in the Lorenz Curve.

Below is a diagram to illustrate how to calculate the coefficient.The Gini Coefficient is a measure of statistical dispersion intended to represent the income distribution of a nation's residents. The Gini Coefficient is computed by dividing the area between the 45o line and the lorenz curve by the area under the 45o line. This index has a measure between 0 and 1. The closer the Gini Coefficient is to 1 the more unequal the distribution of income for a country is.

For instance if the Gini Coefficient rises this means that the index is moving closer to 1 and as a result the income distribution for a country is worsening, increasing the level of income inequality. Graphically this would be represented by an outwards shift of the Lorenz Curve as the richer part of the population hold the highest proprtion of national income. This is traditionally what has happened in the UK economy when we expereicned the recent double-dip recession that widened the gap between the highest and lowest earners.


Glass-Steagall Act - 1933

This was an act introduced after the uncertainties and volatilities of the stock market crash in the late 1920's. It introduced lots of individual forms of regulation to strengthen the financial sector.

It introduced deposit insurance for all depositors up to a pre-determined level. It also prevented financial institutions from merging with one another and as a result commerical and investment banks consolidating and forming a financial conglomerate like Citi Group.


Globalisation

An ongoing process that is improving the integration of the world’s economies to reduce the restrictions on where goods and services are made and sold. This allows large numbers of goods and services to be sold in many countries.

Below shows how globalisation has affected the UK economy in an AD-AS framework.

As the UK has run a trade deficit continuously since 2006 the globalisation impact on AD has been negative (indicated by AD at AD1 rather than at AD). This does not mean there has been no AD growth over that period it just means that the contribution from globalisation has been negative as the UK imports more than it exports. However, globalisation has allowed the UK economy to expand productive processes and capture economies of scale so that it has had a positive impact on the productive capacity of the UK economy (LRAS to LRAS1). Overall, the effect of globalisation is that the UK has expanded its productive capacity (YFE to YFE1) without inflationary effects (P to P1). This is an excellent example of how the expansion of productive capacity is critical to achieving sustainable economic growth. 


Different countries will experience a different balance of demand and supply side effects. Students will need to explain the outcome of these using AD/AS analysis.  


Good

A physical product which commands a price when sold and yields utility when consumed.


Goods

Physical products which command a price when sold and yields utility when consumed.


Government budget

A plan detailing the income and expenditure a government anticipates over a given period of time together with details of any borrowing requirements.

Government failure

When a government intervention (indirect tax, subsidy or regulation) fails to correct a market failure and would create a net welfare loss compared to the free market solution.

Below is a diagram to illustrate how government intervention can sometimes fail to solve market failure and in some cases worsen the welfare belonging to society. In this instance, there is a presence of a negative externality that causes a divergence between the marginal social cost and the marginal private cost curves. Therefore the only way this externality can be removed is if the government introduces a tax equidistant to the distance between the marginal social and marginal private cost curves. However if the government imposes too high a tax then this causes the firm to have a lack of incentive to produce many goods and as a result the dead-weight loss triangle may be even greater than previously. This is normally caused by the government having insufficient information to correct market failure or the government is bowing to electorate pressures and not choosing a socially optimal policy.


Government goods

Goods that are provided by the government e.g. state education. These goods can be either pure public goods or quasi public goods.

Government intervention

When a Government introduces a regulation, indirect tax or subsidy that is designed to overcome a specific market failure e.g taxes to discourage consumption of alcohol and petrol, subsidies to encourage installation of solar panels or state provision of education to correct insufficient supply.

Below is a diagram to illustrate how a government can successfully intervene in a market that is plagued with negative externalities.  In this instance, there is a presence of a negative externality that causes a divergence between the marginal social cost and the marginal private cost curves. Therefore the only way this externality can be removed is if the government introduces a tax equidistant to the distance between the marginal social and marginal private cost curves. In this case the government has successfully imposed a tax of the correct level and this makes the marginal social and private cost curves equal to each other and therefore firms now realise the negative externality they were producing and therefore the quantity being produced is at the socially optimal level. As a result the dead weight loss triangle has been removed and the welfare for society has increased.


Government policy

When a Government introduces a regulation, indirect tax or subsidy that is designed to overcome a specific market failure e.g taxes to discourage consumption of alcohol and petrol, subsidies to encourage installation of solar panels or state provision of education to correct insufficient supply.

Government Spending

The expenditure undertaken by government to provide things like transfer payments, public services and infrastructure.

In the context of measuring Aggregate Demand any expenditure relating to transfer payments is excluded. 

Government spending is one of the key macroeconomic policy levers available to a government to control the business cycle. Increases in government spending cause an expansion in aggregate demand and decreases in government spending cause a reduction in aggregate demand.

Effects of G

An increase in government spending can be funded via raising taxes across the economy and/or borrowing more by selling government bonds. The decision of how the government funds the extra spending depends on the political environment, cost of borrowing and the overall health of the economy. For instance, if the cost of borrowing (i.e. bond yields) are high then the government may decide this is not a good time to borrow to invest in public infrastructure. This is because the returns generated will struggle to exceed the initial borrowing costs and interest charges. However, it may be the case that the government operates in a low growth economy and imposing heavier taxes on economic agents, could create significant long-term damage to the economy and therefore it is not feasible to raise spending by taxes and higher borrowing may be the only option.

Keynesian economists argue that governments should be active in using government spending to impact the economy, in particular encouraging an increase in government spending during recessions. Classical economists are more wary of having too much government spending due to its potential effects to cause or increase a budget deficit.


Government transfers

How governments use taxes and benefits to transfer wealth from the affluent to the needy sections of the economy. This helps to address inequalities in the distribution of income and wealth.

Gross Domestic Product

The total market value of all the final goods and services produced in an economy over a given period of time. This can be determine by measuring the expenditure, income or output of the economy.

Below is a diagram to illustrate the three methods of measuring the level of economic activity via GDP. All three of these methods should lead the same answer in a closed economy.


Gross Domestic Product per capita

GDP divided by the population of an economy. It is a useful way of measuring economic progress i.e. GDP growth may not be perceived as successful if GDP per capita has declined.

Below is a graph to show real GDP per capita changes over the past 30 years and as this is one of the main measures of the standard of living for a country, because this has been increasing over the past 30 years then living standards have been increasing as well.


Gross National Product

Is the final value of all the goods and services produced using labour and property owned by the inhabitants of an economy.

Hard commodities

Hard commodities are industrial materials that are mined e.g. silver, gold. petroleum, coal, gas, copper.

Hard Landing

A sharp slow down in economic growth carrying the risk of a recession after a period of healthy economic growth.

Harrod-Domar Model

Is a growth model used in development economics that states an economy's growth rate is dependant on the level of saving and the capital output ratio. The theory states that developing countries have very low growth rates and therefore the standard of living does not advance rapidly, because of the fact that they have very low levels of saving and each unit of capital is very inefficient.

Below is a logical sequence of reasoning to illustrate that the more developed a country wants to be and the quicker the economy will grow is based on investment levels in infratructure products.


Here is a basic flowchart of how the HD model works. Countries with high savings rate will then provide lots of funds for investment for firms to increase the capital stock for a country and this in turn will lead to an increase in the growth rate of a country and as a result the level of national income/output will increase fuelling further savings and ultimately this cycle wil keep repreating itself.


Heckscher-Ohlin Model

Is a mathematical trade model that states that countries will specialise in goods that they have a relative factor abundancy in i.e. a country will export products produced using factors of production that they are relatively abundant in and import products where production requires the use of scarce factors.


Hedge Fund

Engage in private investments by trading securities on behalf of their clients by hedging against volatility and instability in financial markets. However as hedge funds have become more prominent so has the perceived risiness with them.


Helicopter Money

When a central bank directly finances a government budget deficit by printing more public money. This is an alternative form of the conventional public policy choice of monetary policy but often is overlooked due to the hyperinflation concerns that arise.


Herding Behaviour

Is a term that applies to a trend often seen in investing, in which all investors tend to mimic each others actions and this causes asset prices to significanty decline or rise. These investors may not always be acting rationally.

Below is a graphic which shows the ramifications of asset prices falling due to herding effects. If asset prices fall this causes investors to lose a large value of their investments. Which ultimately can cause a financial crisis or a recession, as confidence from the financial sector drains away.


Heterogenous goods

Goods where the features of products are heavily differentiated e.g smart phones and cars.

Hit-and-run entry

This is a special case of entry that exists in markets that are highly contestable. The lack of sunk costs and the ability to freely enter and exit means that new firms can enter the market and undercut the current incumbent firms to steal the abnormal profit. They can quickly leave the market costlessly before the incumbent has had time to react with a price match. This explains why markets that are classed as contestable, will often see incumbents charging a price close to the marginal cost to prevent being undercut.

Below illustrates the logical sequence of reasoning why incumbent firms keep prices extremely low despite the high degree of market power they have, as they are vulnerable to hit-and-run entry. By keeping prices low the profit rewards and incentives of hit-and-run entry is reduced and incumbent firms feel more secure in their market position. So peversely in these types of market the best way to maximise profits in the long-term is to make small profits in the short-term.


HM Treasury

Is the government department responsible for for formulating and developing public finance and economic policy and controlled by The Chancellor of the Exchequer (currently George Osborne).

HMRC

Her Majesty’s Revenue and Customs. Its main responsibility is the administration and collection of UK taxes.

Homogenous goods

Goods where the features of products are similar e.g gas and water.

If all firms produce exactly the same product there can be no price competition and only non-price competition such as product differentiation and advertising campaigns. This is because buyers have an unlimited option when purchasing this type of good and therefore if all goods are the same, the sole reason for buying a product from a specific firm is solely based on price and if the costs of production are the same undercutting rivals will not steal the market share and sales.


Horizontal Integration

Horizontal integration occurs when there is a merger between two firms in the same industry operating at the same stage of production. For example two firms both producing products in the primary sector merging that would be an example of this type of integration. This enables firms to benefit from economies of scale and build up a more efficient distribution network. A real life example was in 2013 when US Airways merged with American Airlines to benefit from managerial economies of scale to raise efficiency and productivity, as well as increasing the level of market power for the newly merged firm.


Hot money

Short-term money flows between financial assets caused by institutions attempting to generate profits by trading foreign currency, commodities and financial assets. Profits arise from successful speculation (investing when there is an expectation that prices will rise and produce a profit) and arbitrage (making a profit by identifying opportunities to buy an asset in one market and immediately sell it in another market at a higher price).


Hot Money Flows

Capital flows moving to countries with higher interest rates and changes in exchange rates. For instance if the interest rates of a country rise higher relative to that of other countries, investors will implace their money in the financial sector of that country to maximise the return on their investment. These flows occur very quickly and will also cause the exchange rate to strengthen too. If the interest rates cut capital would flow out of the economy and cause the domestic currency to weaken.


Human capital

The productive potential of a single or group of workers. The value of human capital is equal to the future value of earnings and production.

Human Development Index (HDI)

A summary measure of average achievement in key dimensions of human development i.e. a long and healthy life, being knowledgeable and having a decent standard of living. This measure is then used to rank countries into four tiers of human development: low, medium, high or very high.

Below is a table to illustrate how five different countries rank in these key dimensions of human development and therefore the meausre of human development for those countries. As can be seen from the table the UK is classed as having a very high level of human development as the HDI measure is over 0.8. Whereas Nigeria has medium level of human development as the HDI measure is below 0.7.


Human Needs

Are fundamental for human survival purpose. Therefore is something you should have and you cannot do without e.g. water and food.


Human Wants

Are a human desire to get something additional. Wants are unlimited.


Hyperinflation

Large and very rapid increases in the price level which undermine the value of money and discourage economic activity. Defined as periods when the monthly inflation rate exceeds 50%. Usually associated with extreme political instability or war.


Immobility of factors of production

When factors of production cannot be easily applied to another use e.g. a hospital cleaner would not be able to be reassigned to perform heart surgery or it may not be easy to encourage unemployed Spanish workers to fill vacancies in Germany.

Imperfect competition

A market where a small number of large suppliers can set the prices for their products.

Imperfect information

Where either firms or individuals are not aware of all the information that is relevant to make decisions about the supply and consumption of products. The most commonly used example of this is the secondary cars market, in which car buyers cannot determine whether the cars they are being sold are of good quality or of bad quality (lemons). This is a specific form of imperfect information called adverse selection.


Imports

Goods made abroad that are purchased in the UK - any transaction that generates a negative monetary flow out of the UK e.g. money spent on iPhones or foreign holidays.

Below is a graphic that shows imports represent a leakage out of the circular flow of income/expenditure in an economy. This is because money flows from domestic residents to foreign companies that produce these imported goods.

Therefore imports negatively contribute to the aggregate demand curve and if imports increase due to a stronger pound sterling then it will cause the AD curve to shift inwards as net exports for a country falls as shown in the diagram below.


Incentive function of prices

Prices incentivise and influence the decisions of consumers and producers e.g. higher prices encourage production but discourage consumption.

Incidence of tax

A way of analysing how the impact of an indirect tax is shared between consumers and producers. The elasticity of the demand curve affects how much of the tax is passed onto consumers.

Below is a diagram to illustrate how the imposition of an indirect tax implaces a burden on consumers. In this instance the demand curve is neither inelastic or elastic and therefore the tax burden is split evenly between the consumers and producers.

Below is a diagram to illustrate when the demand curve is inelastic and therefore the tax burden is split unevenly towards consumers ahead of producers.

Below is a diagram to illustrate when the demand curve is elastic and therefore the tax burden on consumers is small.


Income

The money earned by factors of production over a period of time e.g. rent, interest, wages and profit.

Below is a table to highlight the four factors of production that go towards producing goods and services in an economy and the accompanying money I would earn.


Income effect

When the quantity demanded changes following a price change if consumer real incomes remain the same i.e. if real income remains constant and prices increase it will not be possible to purchase the same quantity of goods.

Income elasticity of demand

This measures the proportionate change in the quantity demanded of a good in response to a proportionate change in income. Essentially, it is a useful way of measuring the responsiveness of a change in the amount of a good demanded as a result of a change in their personal income. This is an important elasticity measure as income is one of the main driving forces behind consumption patterns of goods.

Below is the formula for calculating YED:

If the YED value is positive we classify the good in question as a normal good and therefore is a good that consumers enjoy to consume and wish to consume at higher quantities the more income is at their disposal.

If the YED value exceeds 1 we can classify the good as a luxury good as this is a good that would require a large swing in income to either encourage the consumer to purchase it in the first place or to stop consuming it and replace it with a good that is cheaper. 

If the YED value is negative we can classify the good in question as an inferior good. This is because if a person's income falls then the quantity demanded of these inferior goods increases as consumers switch expenditure away from normal goods to cheaper alternatives.


Income Inequality

The distribution of income is a measure of the share of income that is distributed across the population of a country. 

An unequal distribution of income is often a characteristic of modern day economies as a perfectly equitable distribution is impossible to achieve. This is because there is no economy in the world by which a perfectly equitable distribution of income can be achieved. This is because in the free market, workers always have the incentive to work harder by being rewarding with higher levels of pay and therefore it is this that drives the income inequality within a country. However, the degree and extent of income inequality varies between countries all on the basis on different levels of economic development, public service access, political and social structure as well as the cultural identity of a country. 

In theory vast amounts of inequality are bad for a country as it negatively impacts individuals standard of living, by damaging their aspirations, opportunities and income. This is compounded by the fact that these individuals will have limited access to the crucial public services within a country such as sufficient levels of healthcare and further education. The economic consequences of this is that it can damage the level of human capital established across the economy, shrinking the quality and quantity of the factors of production and ultimately damaging the productive capacity of the economy, as well as the long-run trend growth rate of a country. 

But despite all of these economic issues created by an unfair distribution of income, governments are never searching for a distribution of income that is perfectly equal as this is not always a sign of a growing and developing economy. This is because an unequal distribution of income could be a sign of economic prosperity that has possibly been brought about by entrepreneurial innovation. Governments therefore accept that a degree of inequality for a country is not always a particular weak feature of the economy as long as it is controlled and has been created via a productive and sustainable way. 

Therefore a good evaluation point to consider is that if the incentive of being rewarded with higher incomes was no longer present in the labour market, then surely an economy would be worse-off despite the fact that theoretically the distribution of income would be fairer, because the positive benefits of individuals striving for a better standard of living will be lost. Therefore, it is up to the government to be able to identify whether a worsening in the distribution of income is a fair reflection of the effort and contribution that certain individuals have made to the economy over time. 

One of the most commonly used methods of measuring the income distribution for a country is to analyse the Lorenz Curve. Below is a diagram which illustrates the income distribution for a country worsening as the Lorenz Curve has shifted out to B. This means that a bigger fraction of income is held by a smaller percentage of people i.e. the very wealthy. Likewise it is the opposite for an inwards shift of the curve. From this measure the Gini Coefficient can be derived, placing the measure of the income inequality of a country into one single figure.

However, despite the measures being simple and intuitive to look at and analyse in theory, they do contain a significant amount of limitations which restrict the ability to accurately reflect the true picture of the distribution of income in a country.  Some evaluation points you could mention are:

  • Limitations behind cross-country comparisons i.e. cannot compare the inequality measures of a developed country in sub-saharan Africa with the inequality measure of a developed country in Europe.
  • Limitations when drawing conclusions about the level of economic development in a country i.e. some countries like the US have high levels of income and development but also a reasonably high level of income inequality.
  • Limitations of the use of inequality measures because of issues regarding data availability and reliability. 
  • Inequality measures are too narrow and often oversimplified and therefore may not provide a true reflection of the distribution of income within a country e.g. does not take into account age distribution or the current level of government policies.  

Income tax

A direct tax imposed on income from employment and investments. assessable earnings are taxed at either the basic (20%), higher (40%) or additional rate (45%).

Increasing Returns to Scale

When a firm increases all the factors of production by a factor and output increases by more than that factor. As a result the average cost for the firm will be falling as output exceeds inputs.

Below is an illustration of how a business would achieve increasing returns to scale. Assuming this firm only uses capital and labour as its inputs. A doubling of the capital and labour input leads to greater than doubling of output as well. Because the average cost is calculated by the total costs/output, if the costs are increasing slower than output, average costs fall over time.


Incumbent Firm

Describes a firm that is already in position in the market. In a contestable market incumbent firms are unable to enjoy abnormal profits due to hit-and-run entry.


Index numbers

A way of simplifying the measurement of averages (e.g. inflation and stock markets) and comparing different data series by establishing a base of 100.

Index numbers are calculated by selecting a base year and then dividing each of the values by that base year value and seeing the proportionate change relative to the base year rather than the percentage change. It is important to remember that index numbers DO NOT show the percentage change in a variable over time. The main benefit of index numbers is they allow cross-variable comparisons with variables that use different measurements. The table shows how the index numbers for GDP are calculated using the method mentioned above.


Indirect tax

Taxes that are imposed on transactions. e.g. VAT, fuel duty, insurance premium tax.

Indirect taxation

Taxes that are imposed on transactions. e.g. VAT, fuel duty, insurance premium tax.

Indirect taxes

Taxes that are imposed on transactions. e.g. VAT, fuel duty, insurance premium tax.

Individual demand

The demand for a good/service from an individual consumer or firm.

Indivisibilities

This is a technical economy of scale. Many economies of scale can only be captured by using large items of equipment that must be continuously used to full capacity. This means that smaller suppliers can’t access the same economies of scale if the equipment isn’t available on a smaller scale.

Inelastic demand

When the percentage change in demand is less than the percentage change in price. In this case the PED elasticity value will lie between 0 and -1.

To identify the shape of an inelastic linear demand curve we do not focus on the gradient of the curve as this does not actually determine elasticity. Crucially, it is the position of the demand curve that determines elasticity. This is because all linear demand curves contain portions on the curve which can be classed as elastic, inelastic and unit elastic. Any demand curve shown (like the one below) is just a section of a much larger demand curve that extends beyond the axis.

So effectively we can see that the midpoint of the demand curve is when unitary elasticity is achieved. The bottom half of the curve is inelastic, because if the price rises - at any point below the midpoint - expenditure increases despite a quantity fall. The top half of the curve is elastic, because if the prices rises - at any point above the midpoint - expenditure decreases due to a large quantity fall.

Therefore, the easiest way to determine an inelastic demand curve is to extend the section of the demand curve drawn and identify which axis it intersects. If the demand curve intersects the x axis we can judge it as being an inelastic demand curve as we must be focusing on the bottom of the demand curve. An example of an inelastic demand curve is shown below.

This diagram highlights the changes in expenditure for a producer that occurs when there is a small price rise in a market with inelastic demand. When a demand curve is relatively inelastic, it means that consumers are price insensitive to changes. In this instance, a price rise leads to a small fall in demand as consumers refuse to switch to alternative cheaper substitutes


Inelastic Supply

When the proportionate change in supply is less than the proportionate change in price. In this case the PES elasticity value will be below 1.

Below is an example of an inelastic supply curve:

The supply curve has the typical upward sloping relationship between price and quantity supplied because the profit incentives that firms face are greater when the price increases. However, with an inelastic supply curve firms ability to raise output in line with a price increase is restricted due to a number of different factors. Which is the main reason why with this type of supply curve the change in the quantity supplied is proportionately less than the price.

These factors are:

1. Amount of Spare Capacity - If a firm has very little spare capacity left, they will not have the sufficient resources to increase output when the price rises.

2. Length of Production Process - If a firm is producing a good that has a long production process their ability to respond to price increases by raising output is restricted as they are unable to raise supply within a short period of time. This is often the case in agricultural markets.

3. Factor Substitutability - A firm will always wish to produce the good that has the highest price, as this is the good that will yield the highest level of profit. However, if firms are unable to transfer their factors of production towards different production processes, this ability to increase output in line with prices is restricted.


Inferior good

A type of good where demand for the good decreases as INCOME rises e.g. own value brand products.

Below is a diagram to illustrate the basic demand curve structure for an inferior good. If the level of real income increases this causes an inward shift of the demand curve as consumers disposable income increases they switch to better quality products that they derive a greater level of utility from. Vice versa if the level of real income decreases this causes an outward shift of the demand curve as consumers can no longer afford normal goods and therefore they switch to cheaper alternatives which are of inferior quality. 


Inferior goods

A type of good where demand for the good decreases as income rises e.g. own value brand products.

Below is a diagram to illustrate the basic demand curve structure for an inferior good. If the level of real income increases this causes an inward shift of the demand curve as consumers disposable income increases they switch to better quality products that they derive a greater level of utility from. Vice versa if the level of real income decreases this causes an outward shift of the demand curve as consumers can no longer afford normal goods and therefore they switch to cheaper alternatives which are of inferior quality. 


Inflation

A persistent rise in the price level within an economy over a period of time. As a result this causes the value of money in the economy to fall, as each unit of currency now buys fewer goods and services.

It is important to note that inflation in a country can be either rising or falling. But as long as the inflation rate remains positive, it can still be classed as inflation as overall the price level is still rising from one period to the next, but crucially not as significantly as the previous period. Falling inflation is called stagflation. Whilst a negative inflation rate is classed as deflation because the general price level falls from one period to the next with a negative rate.

A country's inflation rate is calculated by using a weighted price index (e.g. UK Consumer Price Index) that measures the changes in prices of the everyday goods and services that the average household consumes. It is a weighted index as greater weights are attached to the most popular goods, as price changes in these types of goods will impact households more than luxury items. The inflation rate is then measured by calculating the percentage in this weighted index from one period to the next. 

Inflation in an economy can either be classed as demand pull inflation or cost push inflation. Below is a summary of the AD-AS impact of these two types of inflation.

Both of these types of inflation push the price level up as a result of a macroeconomic disequilibrium and this in turn creates an output gap. Therefore in an exam question it is important to evaluate what is the cause of inflation in an economy and from that you can assess how large an impact this factor has had on the inflation rate i.e. has it caused the inflation rate to increase rapidly or insignificantly. This is important as from this initial evaluation point you can argue and discuss the possible economic policies that may be implemented in response to the inflation rate rising too quickly, in order to protect a country's competitiveness.

Inflation is predominantly used as an indicator about the overall strength and health of an economy as it highlights that the confidence amongst consumers and businesses is high and the labour market is in a strong and robust position. However, if inflation becomes too high then it can create uncertainty and can potentially destabilise the whole economy as money loses its value very quickly. This is known as hyperinflation and is a common problem in developing countries that run infeasible economic policies. As a result, most countries use an inflation target to keep the inflation rate within a narrow range of values. This inflation target is set at a moderate level with higher and lower bounds to ensure macroeconomic stability is in tact. In the UK the Bank of England set a CPI inflation target of 2%.

Inflation can be good and bad for an economy. Some of the benefits are: It can increase confidence and spending, reduce the value of borrower's debt burden, increase business production and reduce real wage costs for businesses. But despite those benefits it can be argued that inflation can be damaging to an economy as it creates uncertainty, lowers capital accumulation, increases menu costs and negatively impacts savers/lenders.

Overall, inflation is a very important discussion point in an exam as the level of inflation in an economy changes when the AD or SRAS curves shift. You will then be required to evaluate the extent of the inflation change by looking at factors such as:

  • The size and significance of the curve shifts
  • The sustainability of the shifts (short run and long run impact)
  • The level of spare capacity in the economy
  • The level of volatility of the inflation rate (the likelihood of creating uncertainty)

Inflationary output gap

When the price level rises as a result of an output gap arises due to a positive shift in AD (positive output gap) or negative shift in SRAS (negative output gap).

The diagrams below illustrate the two main types of inflationary pressures caused by the persistence of an output gap. The left-hand side diagram represents cost push inflation and the right-hand side diagram represents demand pull inflation.


Inflationary pressure

A situation where demand for a good exceeds supply creating pressure for prices to rise.


Informal economy

This is economic activity associated with cash transactions and barter that takes place outside the mechanisms for collecting tax and measuring economic activity e.g. if a house cleaner, is paid cash, no paperwork is exchanged and the money is spent without passing through a bank account or without declaration to HMRC.

Information imperfections

Where either firms or individuals are not aware of all the information that is relevant to make decisions about the supply and consumption of products.

Information problem

When consumers or firms make wrong decisions because they possess insufficient or inaccurate information or because they choose not to take account of relevant information e.g. smokers, heavy drinkers and unhealthy eaters.

Infrastructure projects

Are government funded building projects that maintain and develop the services and facilities that are necessary for an economy to function e.g. provision of transport, utilities and telecommunications.

Injections

Positive flows in to the circular flow of income generated by revenue from exports, government spending and investments (loans and credit).

Below is an illustration of some of the most common injections which draw money into the circular flow of income and expenditure from foreign entities. The most obvious example of this is the demand for a country's exports from respective foreign countries, as well as forms of  foreign direct investment (FDI).


Innovation

Innovation is the development and improvement of existing products, processes, services, technologies, or ideas.


Insurance Company

A company that sells insurance policies to an individual for suitable protection against adverse events. These companies are charaterised by long-term liabilities of uncertain vaue and liquid value-certain assets. Among the major categories of financial institution, this balance sheet structure is least likely to give rise to systemic risk, as asset transformation function in the reverse direction of banks. However, the main form of regulation imposed on insurance companies is based on consumer protection, reflecting the fact that it is difficult for consumers to assess an insuree's financial strength or the quality of its products.


Intellectual property right

This gives firms or individuals an exclusive right to receive all the benefits that arise from any of their innovations or creations. This right will last for a number of years and will be easier to enforce where a patent is granted or if a clear copyright exists.

Interbank Lending

When banks extend loans to other banks for a specified period of time. These interbank loans are typically of a short-term maturity of one week or less, which many being classed as 'overnight loans'. The loans are made at the interbank rate.

Below is a graphical depiction of how an interbank loan works, in which there is a transfer of money and that money has be to paid alongside a level of interest attached to the base rate.


Interdependence

This is where the outcomes for firms depend not only on their own decisions but also upon other firms' decisions. Oligopoly markets are the type of market structure that is characterised by a high level of interdependency as firms always have to take into account the reaction of rival firms when setting their own prices.

Below is an illustration of how interdependency works. For instance Firm A sets a unit price of £10 but the market outcome of that pricing decision depends on the type of reaction that Firm B takes. The flowchart shows that Firm B could react in three ways. Firstly they could end up charging more than £10 which means that Firm A will have undercut Firm B and steal the entire market for themselves (assuming competing over a homogeneous good). Firm B could also match the price of £10 and both firms would roughly share the market between themselves. Finally, Firm B could also decide to undercut Firm A and charge a price lower than £10 and as a result they would capture the entire market. Therefore, before Firm A sets their price they have to form a rational expectation of what other firms in the market will do, to be able to set their profit-maximising price.


Interest

The reward for providing capital.

Interest rate

The price of money i.e. the cost of borrowing and the reward for lending money. The rate is determined by forces of demand and supply on money markets.

Internal economies/diseconomies

Economies of scale or diseconomies of scale that arise because of the growth of a firm.

Internationalisation

Describes the commercial activities that firms and businesses internationally engage in. For instance in the banking world this refers to the trend that financial services are conitnually becoming global and products and services can be sold to international cutomers. This has created complexities for regulatory authorities when regulating the industry.


Intervention prices

The price levels (high and low) that a Government will monitor to determine when to intervene in markets to support or stabilise prices.

Interventionist

A policy perspective that favours government intervention in order to correct any market failures present and in the process increase the level of economic welfare in society. Policymakers that take this perspective, believe that the only way a government can fulfill their macroeconomic objectives is for a heavy layer of government intervention to be administrated.

The type of interventionist policies include:

  • Regulation
  • Nationalisation
  • Investment in human capital
  • Investment in infrastructure
  • Investment in technology

The aim is to shift the LRAS curve to the right as shown by the diagram below:

Apart from reducing the price level and increasing real output, interventionist policies create a number of different advantages for an economy:

  1. Greater equality - redistributes income and wealth to improve equality of opportunities.
  2. Corrects market failure - governments can ensure that markets do take into account of the externalities involved in the consumption/production of goods and services.
  3. Heals economic cycle problems - intervention helps overcome downturns in the economy.
  4. Increases economic efficiency and productivity - increases productive capacity of the economy.

However, these types of policies can also create problems in an economy and these are the evaluative points you should consider when talking about government intervention:

  1. Government failure - without full information can be pressurised by certain political groups to pursue inefficient projects. 
  2. Loss of efficiency savings - nationalisation creates more state owned industries which lack profit making incentives and this could fail to drive up efficiency and lower costs.
  3. Restricts freedom - government intervention takes away the decision making process from private individuals which goes against the free marketeer view (the market is best at deciding what and how to produce goods and services).

Invention

The creation of a product or way of doing things for the first time.


Investment

When capital is purchased to increase productive capacity.

A key aspect is that the cost of purchasing capital is considered expenditure and is part of Aggregate Demand. However, the purpose of purchasing additional capital is to increase productive capacity which will influence Aggregate Supply i.e. outward LRAS shift. Distinguishing these two outcomes using AD/AS analysis is a minimum requirement for success at Economics A-level.

The increase in expenditure has an immediate impact (as soon as the capital is purchased) while changes in productive capacity will take longer to emerge (as it takes time to integrate capital into the productive process the impact on output also takes time to emerge).


Investment Bank

A financial institution that assists individuals, corporations, and governments in raising financial capital by underwriting or acting as the client's agent in the issuance of securities.


Investment good

A good that is purchased if there is an expectation it will increase in value over time e.g. classic car, antiques, commodities.

Investment goods

A good that is purchased if there is an expectation it will increase in value over time e.g. classic car, antiques, commodities.

Investment income

Income generated by the investments owned by individuals and firms. The income is a reward that is paid for the use of the capital

Invisible trade

Trade in services and other intangible financial items.

John Maynard Keynes

Is the famous English economist associated with Keynesian economics. The General Theory of Employment, Interest and Money (1936) is his most famous work.

Joint demand

A good which is purchased alongside another good as the combined outcome helps to satisfy a want or desire.

Below is a set of diagrams to illustrate joint demand in a demand and supply framework. In this instance an increase in demand for printers, similtaneously raises the demand for ink cartridges. This is because no individual can use a printer without accompanying ink cartridges so there has to be a joint demand for this product. The same intuition holds for razors and razor blades.


Joint supply

When a good is supplied as result of the supply of another good, typically because a number of goods can be produced from the same raw materials/process or if remnants from the production process can be used to produce something else.

Below is a set of diagrams to illustrate joint supply in a demand and supply framework. In this instance an increase in demand for beef, raises the price of beef and as a result increases the supply if beef due to higher profit incentives. If more beef is produced then this should increase the supply of leather as leather is produced from beef. Therefore beef and leather are in joint supply.


Keynesian AS curve

Keynesian economists believe that supply is the same in the short and long term and that there is no need for a separate SRAS curve. The Keynesian supply curve is perfectly elastic at low levels of real output and transitions to a perfectly inelastic curve as real output approaches the full employment level.

The diagram below illustrates the Keynesian view of the aggregate supply curve. Unlike the classical view, the keynesian view suggests that the supply curve is not always inelastic at every point i.e. there is a point in the economy when spare capacity exists and firms can increase production (elastic part of curve). But there is also a point in which full capacity is reached and therefore production cannot be changed (inelastic part of curve). This logic is summarised in the table next to the graph.


Keynesian economics

Is based on the work of John Maynard Keynes during the great depression. Amongst other things the main belief is that optimal economic performance can be achieved by using fiscal policy to manipulate aggregate demand. This is especially important during recessions and depressions.

Kinked Demand Curve

Is a model based on the theory of game theory, by graphically illustrating the high level of interdependence that exists in an oligopoly market. The idea is the demand curve has a kink to represent that a firm faces two different sections of their demand curve - which differs from the conventional downward-sloping demand curve. They face an elastic demand curve above the market price and an inelastic demand curve below the market price.

Below is an illustration of the kinked demand curve facing markets that have a high degree of interdependency, with the demand curve being elastic above the prevailing market price and inelastic below the prevailing market price. This is all caused because of rival firm reactions.


Labour

The human capital applied to the production process in return for wages i.e. the workforce of an economy. This includes the physical and mental efforts that workers put into the production process.


Labour force

Is a collective measure for all of the workers who are able and willing to work i.e. sum of the individuals who are either employed or unemployed. This is one of the best measures of the strength of the labour market of a country.


Labour force survey

A quarterly survey of the UK labour market completed in accordance with internationally agreed standards. It is a wider measure of unemployment than the count of the number of people receiving Job Seekers Allowance and provides far more detailed view of employment in the UK in a format that facilitates accurate international comparisons.

Below is the LFS measure of the UK unemployment rate from 1971-2014.


Labour hoarding

Is a term that describes the employment practice of firms keeping workers on the payroll despite an economy going into recession. The decision is made to keep these workers so that firms can quickly regain profitability when the economy recovers. The firm sacrifices profit during the period in which the economy is in recession, so that they can recoup the lost profits when recalling the workers. This is because the workers are already experienced in the environment of working in the company so they can move back into the company seamlessly. therefore, the firm avoids the costly training process of hiring new recruits. This is a strategy that is predominantly used with firms that provide jobs that require a lot of training for the workers.


Labour market imperfections

Aspects of the labour market which causes the prevailing wage rate to lie above or below the equilibrium wage rate. As a result markets will fail to achieve efficient outcomes.

Below is a diagram to show a wage rate that is forced above the equilibrium wage rate creating excess supply classical unemployment. This could be caused by lots of factors such as imposition of a minimum wage, trade union intervention, lower welfare benefits or sticky wages.


Labour Productivity

The amount of output per unit of labour.

Below is a diagram to show the growth in UK labour productivity since 1960. It has been growing close to a linear trend.

Source: ONS


Laffer Curve

A curve showing how the amount of tax raised varies with the percentage rate of tax levied. It shows that although there is a positive relationship between the tax rate and revenue at low percentage rates of tax, the tax raised ultimately reduces when the percentage rate starts to rise to high levels, as this discourages workers from providing additional labour or encourages individuals to avoid paying the tax.

Below displays the typical shape of a Laffer curve and highlights that all economies have an optimal tax rate and this tax rate exists at point a in the diagram below. Perversely, in this instance if the tax rate is increased to point b the level of tax revenue falls, this is the key insight behind this curve. Because if the tax rate becomes too high workers lack the incentive to work.


Land

The factor of production that not only covers land but also the sea and anything that can be extracted from it (mining and fishing) or produced using the land (farming and forestry). It does not include any property built on land. Rent is the reward paid for the use of this factor of production.

Law

A theory that is supported by extensive empirical research.

Law of Demand

This is the theoretical explanation of why the demand curve for most goods and services is downward sloping i.e. an inverse relationship between the price of a good and the quantity demanded of that good.

This is best explained by the fact that when there is a change in the price of a good it affects the ability and willingness of individuals to consume the good at the new price. For instance, if the price of the good falls, more individuals are able to consume the good as it now fits into their affordability range. Also, some consumers that could afford the good before the price change, but were not willing to purchase the good at the original price because it was beyond their own value placed on the good, may well be incentivised and encouraged to purchase the good at the new lower price. The combined effect of these two consumption channels leads to the quantity demanded for the good or service in question to increase in response to a price fall. 


The only case the law of demand does not hold for a particular good is when we are considering a veblen good. In this rare and often theoretical case, demand actually rises with the price of the good.


Law of Diminishing Marginal Returns

A firm in the short-run will eventually experience diminishing marginal returns i.e. as the firm keeps on adding a flexible factor (labour), the amount the additional resource can produce decreases.

Below is an example of how the law of diminishing marginal returns can be illustrated both graphically and numerically. The marginal product is positive for each additional worker, which emphasises that each worker is contributing to the level of output for the firm. But this marginal product starts increasing at a decreasing rate after worker 2. This does not mean that any workers employed after worker 2 is less productive and less efficient but just that the conditions in the workplace for this firm to absorb extra workers without additional capital and infrastructure is restricting the amount of output future workers can make. For instance, if a bakery shop keeps employing new bakers without increasing the number of ovens available for bakers to use will mean that the value of each additional baker hired in terms of output will be lower, as each of the bakers are having to queue up to use each of the ovens.

Therefore, given that this law exists this causes the marginal cost curve to have the shape that it has below. This is because the marginal product is rising for the first extra workers hired and therefore the marginal cost is low. But as the marginal product belonging to each worker begins to fall the marginal cost begins to rise as the firm moves closer and closer towards full capacity.


Law of Diminishing Marginal Utility

This is an economic law that states that the marginal utility received decreases as a consumer buys more units of a good. This happens because in the eyes of the consumers the value of the good diminishes for every extra unit they buy e.g. a chocolate bar. However, this does not mean that consuming an extra unit does increase total utility, just that it may not add as much utility as the previous units.

Below illustrates the declining utility for a consumer for every additional chocolate bar they consume but total utility continues to increase.


Leakages

Negative flows out of the circular flow of income generated by payments for imports, taxes and savings.

Below is an illustration of some of the most common leakages which draw money out of the circular flow of income and expenditure towards foreign entities. The most obvious example of this is the demand for a foreign country's imports, as well as forms of savings being placed in foreign financial institutions.


Lender of last resort

The main role of the Bank Of England. In the event that banks or the government is not able to borrow money from commercial markets the Bank of England is required by law to make finance available e.g. if the markets do not take up the offer of a new issue of gilts by the UK government, the Bank of England is legally obliged to do so.

Liabilities

The claims that agents have on the bank and these are used to finance the banks asset purchases.


Libertarian Paternalism

The notion that free will and free choice should be preserved, however the government acts to influence a citizen's choice to improve social welfare.


LIBOR

(London Interbank Offered Interest Rate) is the average interest rate estimated by leading banks in London that the average leading bank would be charged if borrowing from other banks i.e. the bidding rate for overnight loans.


Limit Pricing

Is a pricing strategy, where products are sold by the firm at a price which is lower than the average cost of production or at a price low enough to make in unprofitable for other players to enter the market.

Below is a diagram to illustrate how this type of pricing strategy works. The reason why firms undertake this pricing strategy is to protect their market share and position by successfully deterring new entrants from coming into the market. To do this however the incumbent firm has to sacrifice the amount of supernormal profit they can achieve. In the lefthand side diagram the incumbent has lower costs than new entrants, therefore if they both charge the same price incumbent firms make a large amount of supernormal profit equal to the size of the green arrow. However, new entrants at that price can also make profits due to the price being positioned above their respective LRAC curve (but these profits are substantially lower). So if the incumbent firm did not change the pricing stratey new entrants would always have the profit incentive to enter the market. However, if the incumbent firm takes advantage of their lower costs and charges lower prices to a point which is equal to the point on the LRAC curve for new entrants. These entrants would no longer have any profit incentive to enter the market as they will be charging a price at the marginal cost and just making normal profit. Therefore, incumbent firms sacrifice short-term supernormal profits to guarantee larger long-term profits equal to the size of the red arrow in the right hand side diagram. This is an example of successful limit pricing with the aim to protect and consolidate their market share and position.


Liquidity

How easy it is to convert an asset into cash without experiencing a significant price impact or encashment delay e.g. an instant access deposit would be regarded as highly liquid while a property asset would be regarded as highly illiquid.


Liquidity Coverage Ratio

A ratio used to ensure that financial institutions have the necessary assets on hand to meet short-term liquidity requirements. Under this standard, the banks must hold a stock of unencumbered liquid assets to cover the total net cash outflows.

Below is the formula for calculating the LCR ratio. This ratio must exceed 1 in order for the financial institution to have enough liquid assets to cover volatile liabilites and remain in a solvent position on the balance sheet.


Liquidity Crisis

Is when a bank's balance sheet is in a position of a large liquidity mismatch. This can occur because of the liabilities maturing earlier than the assets and therefore bank's are left with no option but to sell their assets off at a firesale price prompting fears of a bank run and ultimately, if severe enough, can lead to bankruptcy.

Below is the logical sequence of reasoning for a liquidity crisis to summarise the main stages at which it occurs inside a bank's balance sheet.


Liquidity Trap

Is a term associated with John Maynard Keynes defining situations where injections of new money into the banking system (e.g. quantitative easing) fail to stimulate lower interest rates and economic growth because economic agents hoard the extra cash and don’t spend it.

Loan (Advance)

When a bank channels funds from savers to borrowers. The borrowers are deficit units - total expenditure exceeds total income - and require borrowed money from the bank to meet their spending plans. The loan requires borrowers to contractually pay back periodic payments linked with a specific interest rate to help banks make profit.

Below is the flowchart to illustrate how money flows from savers through the bank to borrowers.


Long run aggregate supply curve

The total productive capacity of an economy. It is equal to the full employment level of real output and is vertical at the point of full employment.

The LRAS curve illustrates that in the long-run unless there is a change in the size or productivity of the factors of production employed, supply will always exist at the full employment level and will not vary with price, as the economy is at full capacity. The diagram below highlights the typical shape of an LRAS curve.


Long-run

When all factors of production are flexible i.e. the business is able to change capital and land when they wish to do so.


Long-Run Phillips Curve

This curve is a straight vertical curve and shows that no matter the rate of inflation, in the long-run the rate of unemployment is consistently the same. In other words, in the long-run there is no trade-off between inflation and unemployment

Below is a diagram to show how the long-run version of the Phillips curve is formed. An expansion in AD creates economic growth and reduces unemployment below the natural rate of unemployment and this moves the economy to point B as jobs are created in the short-term. However workers now have more bargaining power, workers demand higher wages and this forces production costs up to a new higher level for firms, these then eventually get passed on as higher prices. Eventually in real terms nothing changes as the economy ends up at the natural rate of unemployment but just with a higher level of inflation. This is shown by the upwards shift of the short-run Phillips curve. This process continues to repeat itself with the only substantial effects being inflationary effects. Therefore the LRPC is derived from the continual shift up in the SRPC due to economic agents rational expectations.


Long-term trend growth

The long term direction of output growth assumed to represent the productive potential of an economy.


Loose monetary policy

Policy decisions designed to reduce the cost of credit and stimulate AD i.e. to counteract deflationary possibilities.

The diagram below illustrates the most common form of loose monetary policy which involves cutting the base rate and injecting some level of economic activity into the economy. It does this by making credit to businesses and consumers from bank's easier to obtain.


Lorenz Curve

A graph which indicates the level of income inequality for a country by plotting the cumulative percentage of total national income against the cumulative percentage of the corresponding population.

Below is a table and diagram to illustarte how the lorenz curve is formed. The Lorenz curve bends away from the x axis as generally the bigger the population segment the bigger the percent of total income belongs to them. But the closer the curve is to the line of equality (income is equally distributed amongst all income groups) the fairer the distribution of income across the country. Likewise the more bowed out the lorenz curve becomes the more unequal the distribution is as a very samll percentage of the population holds majority of the income of a country.


M0

Often called narrow money which includes sterling notes and coins in circulation plus central bank reserves. All the items included are typically associated with being the most liquid assets in the economy at that particular point in time.


M1

Notes and coins in circulation plus non-interest bearing sight deposits held by the non-bank private sector.


M2

Notes and coins in circulation plus all retail deposits (including retail time deposits) held by the non-bank private sector.


M3

Notes and coins in circulation plus all sight and time deposits held with banks (excluding building societies) by the non-bank private sector.


M4

Often called broad money and includes notes and coins in circulation, deposits, repos and securities with a maturity of less than five years held by the non-bank private sector. All the assets included in this monetary aggregate are characterised by being illiquid assets. M4 is a key statistic because it can illustrate the underlying strength of economic activity within a country i.e. during a recession the M4 growth rate usually declines quite rapidly as economic activity diminishes during these periods.

M4 is a key statistic because it can illustrate the underlying strength of economic activity.

Macro equilibrium

When real output and the price level are stable because AD = AS.

This equilibrium is highlighted below due to the lack of an output gap and therefore in this instance the economy is at the full employment level.


Macro Prudential Regulation

Is when regulation of banks is carried out an industry-wide basis rather than individually scouring their balance sheets for risk which is entailed in micro prudential regulation. More specifically it involves identifying, monitoring and dealing to remove risks that threaten the stability of the financial system. This type of regulation in the UK is carried out by the FSA and PRA, mainly to ensure the systemic stability of the industry holds.


Macro-economics

Considers the economy at a national level and the impact of a range of domestic and international variables on economic performance.

Macroeconomic objectives

Policy goals set by the government which represent a strong and stable economy. The objectives are:

  • Sustainable economic growth
  • Low and stable inflation rate (Consumer Price Index target of 2%)
  • Low unemployment (Close to full employment)
  • Sustainable current account on the balance of payments


Macroeconomics

The high level study of the whole economy with particular interest in understanding and explaining economic growth, inflation, employment, international trade, government finances and the distribution of income.

Managerial economies

The scope to benefit from specialisation and division of labour at management level increases as firms increase in size. There is also more scope to fund expert opinion from external consultants which provides advantages compared to the position when the firm was smaller.

Mandated Choice

Forcing people to make a conscious choice may lead to better outcomes as an end product. This is best illustrated by looking at the organ donation market in Sweden, in which saw individuals have to make a compulsory choice on whether to donate their organs or not. This imediately lead to an increase in the number of organ donations on the back of this compulsory choice.


Margin

A point where things can change from. In economics this normally means the difference between the current and next unit consumed or supplied.

Marginal analysis

The analysis of the effect of each successive unit of production or consumption of a good or service.

Marginal Cost (MC)

The cost of increasing production by one extra unit.

Below depicts an example of a firm's marginal costs associated with different levels of output produced. The marginal cost curve has a 'tick' shape because for small levels of output the marginal cost falls due to exploiting productivities and efficiencies. But as output becomes too large, production costs start to escalate and this explains why very sharply for high levels of output the marginal cost curve rises.


Marginal cost/benefit curves

These are simply different labels for demand and supply curves. It is normal to use these labels for analysing externalities.


Marginal external benefit

The additional benefit imposed on third parties by the consumption of an extra unit of a good or service. The benefit may be negative or positive.

Below is a diagram to highlight the external benefit that is present in a market with a positive consumption externality. This measures the size of the external benefit that will be realised from third-parties if the amount of goods consumed rises to the socially optimal amount i.e. it is the opposite of a dead weight loss triangle. In this instance the marginal external benefit exists because there is a divergence between the marginal private benefit and the marginal social benefit curves.


Marginal external cost

The additional cost imposed on third parties by producing an extra unit of a good or service. The cost may be negative or positive.

Below is a diagram to highlight the external cost that is present in a market with a negative production externality. This measures the size of the external cost that will be realised from third-parties if the amount of goods produced falls to the socially optimal amount In this instance the marginal external cost exists because there is a divergence between the marginal private cost and the marginal social cost curves. The reason this good is overproduced is because the individual producers do not realise this external cost they are releasing onto society.


Marginal private benefit

The benefit a consumer enjoys by consuming an extra unit of a good or service.

Marginal private cost

The cost a supplier incurs by producing an extra unit of a good or service.

Marginal productivity of capital

The increase in output that arises from the application of the last unit of capital stock.


Marginal propensity to consume

The proportion of an increase in income that households are likely to consume.

Marginal propensity to save

The proportion of an increase in income that households are likely to save.

Marginal social benefit

The total benefit enjoyed by consumers and third parties from the consumption of an additional unit of a good or service.

Marginal social cost

The total cost incurred by suppliers and third parties due to the production of an additional unit of a good or service.

Marginal Utility

The utility received from purchasing an extra unit of a good.

Below is a table that shows how the level of marginal utility differs from total utility. It is a general feature of consumer preferences that the larger the quantity of a particular good a consumer consumes the less utility the consumer receives for each additional unit. This is because the more of a good that a consumer consumes/buys the less value they derive from it. However, as long as the marginal utility does not become negative, consuming extra units of the good will still increase the level of total utility accruing to the consumer. This is the basic property of monotonicity that all consumers have.


Market

A physical or virtual location where buyers and sellers are able to buy and sell goods and services.

Market clearing price

The price at which quantity demanded is equal to quantity supplied. There is no momentum from demand and supply imbalances for price or output to change.

Below is a diagram which shows the clearing price in both an individual goods market as well as the economy.


Market demand

The total demand for a particular good or service i.e. the sum of the individual demand of all consumers.

Below is an example of how to derive the market demand curve. At every individual price it needs to be calculated how many consumers are willing to buy a certain amount of goods. This is shown in the table below.

Below is the illustration of the market demand curve using the data in the table. As can be seen from the graph, the demand curve for the market has the same basic downward-sloping shape as the individual demand curve, to signify that the law of demand still holds for the market as it does for the individual demand curves.


Market economy

A system where the market forces of demand and supply determine what is produced, how it is produced and who it is produced for, without any government intervention.

Market failure

When the market fails to allocate resources efficiently i.e. the market uses too many or not enough resources to produce a particular good

Market power

When an individual supplier or consumer possess enough power to influence the market outcome.

Market power is highest amongst monopolists as they dominate the market and therefore do not have to worry about the reactions of rival firms. They prominently set a price above their marginal cost to extract as much supernormal profit from the market as possible compared to a firm in a competitive market as the diagram below shows.


Market share

The share of market output accounted for by a single supplier. It is normally expressed as a % share of the total output/revenue.


Market Size

Measurement of the total volume of a given market based on revenue.

Below is an example of how this can be calculated for a fictional market. This is done by adding up the total revenue of all the firms in the market and therefore is an indicator of the value of the business that these six firms are conducting.


Market structure

The characteristics of a market e.g. number of firms, barriers to entry and exit, the extent of product differentiation and any information imperfections.

Market supply

The total supply at a given price of all the individual suppliers in a market.

Below is an example of how to derive the market supply curve. At every individual price, it needs to be calculated how many firms are willing to produce/supply a certain amount of goods. This is shown in the table below.

Below is the illustration of the market supply curve using the data in the table. As can be seen from the graph, the supply curve for the market has the same basic upward-sloping shape as the individual firm supply curve, to signify that the market will always be willing to supply more goods the higher the price is. This is because of the profit incentive associated with bigger margins.


Marketing economies

Scale will allow firms to enjoy pricing advantages by purchasing stock in large quantities or by negotiating exclusive deals with large wholesalers and retailers. The negotiating power of firms will increase as they grow in size.

Maturity Date

The final payment date of a bond at which point the principal is due to be paid.


Maximum Price

This is the highest price permitted by a price control.

Below is an example of a maximum price set in a market by the government to prevent a good from being sold at an excessively elevated price. In this instance this good cannot be sold below the maximum price in the market as this is strictly prohibited.


Maximum price scheme

A scheme imposed by government regulation which prevents prices rising above a certain level. Maximum prices are normally set at a level below current equilibrium price.

Below is a diagram to illustrate a successful intervention from the government to impose a maximum price in a market. Because the price is positioned below the current market price it creates an artificial excess demand. But unlike in ordinary markets, market forces do not ensure that this disequilibrium is cancelled out because the price cannot rise to a higher level above the maximum price. As a result this excess demand is left unsatisfied and increases the probability of black marketsopening up to satisfy this unmet demand.


Medium of Exchange

An item that buyers will exchange with a seller when they want to purchase goods or services to avoid the inefficiencies of a barter trade system. This is one of the three main functions of money alongside a unit of account and store of value, to ensure an efficient and successful monetary system.

Below is an illustration of how the invention of a monetary system facilitates a medium of exchange for money (which has no intrinsic value) for goods of perceived equal value. In all advanced economies money is universally accepted as an acceptable means of payment and therefore transactions like this one below occur millions of time during the day.


Merger

A term that involves two companies combining their business operations to go forward as one company and under one name. This is often done in order for the companies to benefit from economies of scale and increase their market power and share against more dominant firms. For example the merging of Safeways and Morrisons created the fourth biggest supermarket in the UK.


Merit good

A good that is under-provided and under-consumed by the market e.g. education, health and museums. 

The market failure in these types of goods is caused by a divergence between the marginal private benefit and the marginal social benefit curves. This is because when individuals consume merit goods it releases positive consumption externalities which society benefits from and values but the private individual does not. Therefore, because the individuals are unaware of the higher social benefit, the MPB curve always lies below the MSB curve and this leads to the good being under-consumed in the market e.g. the long run benefits to the economy and economic growth of individuals pursuing higher education. 

A merit good is normally under-provided and under-consumed because of three factors:

  • Imperfect Information
  • Presence of Positive consumption externalities
  • Poor decision making - takes into account short-run costs but ignores long-run benefits

However, evaluating whether a good is classed as a merit or demerit good depends on the subjective value of the individual i.e. not all individuals value a cultural trip to a museum. 

Below is a diagram to show an example of a market for a merit good:

The degree of market failure in this market is highlighted by the dead weight loss triangle - this measures the external benefit that the market has not exploited because of the under consumption.  

Therefore to eliminate this market failure and to provide the market with the socially optimum level of output, the government must intervene to correct the difference between the MPB and MSB curves. Governments will try to increase the supply of the good, which in turn will increase the consumption of the good. The level of government intervention will depend crucially on the size of the external benefit foregone as a result of the market failure. For extremely important merit goods such as health care and education, the government is likely to introduce subsidies to ensure that these types of goods are free at the point of consumption. The impact of the subsidy will be to reduce the costs of production for the market providers of the good and this will shift the MPC curve outwards (The size of the MPC curve shift will depend on the value of the subsidy imposed on the market). If the subsidy is applied correctly to the market this means the socially optimal level of output will be produced and the market failure will be eliminated. This is shown in the diagram below:

But, just because the government intervenes in the market, this does not guarantee that the market failure will be eliminated. Potentially intervention by the government could worsen the market failure and this creates government failure. Also the success of applying the subsidy on the market depends on the ability to calculate the value of the positive consumption externality for this good and this is very difficult to quantitatively calculate for governments. 

The rule of thumb is that as the size of the dead weight loss triangle increases, the level of government intervention will increase as governments will be more confident of improving the current market outcome. 

It is important to not assume that all merit goods are public goods despite the level of government provision in these types of markets. This is because many merit goods have a finite supply and as a result all these goods can be provided for by the private sector at a price. For instance, health care in most countries is charged for.


Micro economics

Considers the behaviour of consumers and firms in determining the quantities bought and sold of specific goods and services.

Micro Prudential Regulation

Regulation that focuses on the stability and consistency of individual banks, including the individual risks related to each of their balance sheets.


Microfinance

Is the supply of loans, savings, and other basic financial services to the poor.


Microfinance Institution (MFI)

These are the financial institutions that provide and facilitate basic financial services to the poor in developing and emerging economies. There are three varities of MFI: Credit Unions, Commerical Banks, Governmental Organisations.


Milton Friedman

Is a famous American economist who initiated Monetarism in the 1960s as an alternative to Keynesian economics. His views gained ascendancy during the 1970’s and 80’s and have heavily influenced monetary policy and fiscal policy in many countries

Minimum Efficient Scale (MES)

Is the output level at which any economies of scale have been fully exploited and the LRAC curve is at the lowest point.

Below is an example of how a firm can achieve the MES. One important point to note is that the larger the level of output that needs to be produced to reach the MES the less contestable the market is. This is because it is extremely difficult for new entrants to produce at such a large scale at the embryonic stage of their development. Often if the MES is so far along the LRAC curve this means that the market is a natural monopoly.


Minimum Price

The lowest price that it is legal to trade at and will only be binding if it is set higher than the market equilibrium price. The price floor creates excess supply in the market and as a result of that, it is usually used in conjunction with other policies if the purpose of the price floor is to protect suppliers.

Below is an example of a minimum price implaced in a market by the government to prevent a good from being sold at an excessively low price. In this instance this good cannot be sold below the minimum price in the market as this is strictly prohibited.


Minimum price scheme

A scheme imposed by Government regulation which prevents prices falling below a certain level. Minimum prices are normally set at a level above current equilibrium price.

Below is an example of a minimum price implaced in a market successfully. In this instance the minimum price creates an artificial excess supply as producers have a greater incentive to produce more at a higher price but consumers wish to consume less and switch to cheaper alternatives. But this only occurs if the minimum price is placed above the prevailing market price as shown below. If it is placed below the current market price then it would have a neglible effect on the market.


Minsky Moment

Is a sudden major collapse of asset values which is part of the credit cycle or business cycle. Such moments occur because long periods of prosperity and increasing value of investments lead to increasing speculation using borrowed money. This term was named after the economist Robert Minsky.


Misaligned Incentives

The incentives of the agent encourage him to take a course of action which is not optimal for the principal.


Mixed economy

An economy where the factors of production are owned publicly and privately. e.g. The UK has a public and private sector.

Monetarism

A school of economic thought influenced by the work of Milton Friedman. The central belief is that the size of the money supply is the principal driver of economic growth and inflation.

Monetary Aggregates

Official categories used by the Bank of England to measure the total value of the money supply within an economy at a particular point in time. In the UK these include M0, M1, M2, M3 and M4.


Monetary policy

Policies that manipulate the money supply and interest rates and regulate the activities of banks to achieve monetary objectives such as an inflation rate target and availability of liquidity (loans). In recent times, governments around the world have transferred responsibility for monetary policy to central banks.

Below is a list of the main forms of monetary policy that the Monetary Policy Committee (MPC) decide to use to control inflation and meet the Consumer price index (CPI) inflation target of 2%.

The most common form of monetary policy is for the central bank to make changes to the bank rate (interest rates) and this in itself can come in two different forms depending on the state of the economy:

  • Tight Monetary Policy (Expansionary)
  • Loose Monetary Policy (Contractionary)

Below highlights the effects on the economy of these types of policies:

In the case where inflation is below target, the bank rate needs to be cut to encourage economic activity (i.e. consumption and investment). This creates more demand and feeds into the AD curve outwardly shifting to AD1. As a result the negative output gap has been removed and inflation has been restored to stable level, in and around the central bank's CPI inflation target.

In the case where inflation is above target, the bank rate needs to be increased in order to discourage economy activity, in order to prevent the economy from overheating. This reduces demand and feeds into the AD curve inwardly shifting to AD1. As a result, the positive output gap has been removed and inflationary pressures have been controlled to a stable level.  

However, using monetary policies to control inflation is not an exact science and there will be lots of external factors that impact the effectiveness of these types of policies.

The main evaluative point to make regarding this, is that the ability of the central bank to influence economic activity and the inflation rate all depends on the current level of interest rates. For instance, if a central bank wishes to stimulate AD to lift economic growth and inflation, the ability to do so will be constrained if interest rates are already close to zero. When interest rates are at or close to zero this is called the 'zero lower bound' and it means that the ability of the central bank to stimulate the economy through the conventional transmission mechanism is reduced as predominantly central banks avoid interest rates becoming negative - as this encourages agents to hold cash instead of placing in a bank account. From the banks perspective, negative rates encourage them to keep hold of their cash as by lending they have to pay the interest to the borrowers. Therefore, conventional monetary policy is only effective if interest rates are not already near zero.

For instance, the impact of a rate change on economic activity will depend on the level of confidence in the economy at a particular point in time. If confidence in the economy is high, then a rate increase to curb inflation will not be as effective due to consumers not deterred by the higher borrowing costs such is the level of confidence they have. 

Another point to evaluate is the presence of significant time lags when dealing with monetary policies i.e. according to the transmission mechanism, it takes two years for interest rate changes to feed into the inflation rate and this makes implementing monetary policies more problematic as policymakers (MPC) need to predict the inflation rate two years in advance. Of course, inflation forecasts are often inaccurate as there are many economic shocks which forecasts cannot account for which eventually affect the actual inflation rate realised in two years time. This inaccuracy in forecasts often leaves policymakers only making gradual changes to the bank rate rather than significant changes - so they can gauge the initial reaction and level of confidence in the economy. If the policy is successful then it paves the way for further rate changes. 


Monetary Policy Autonomy

This is where a country has complete control of their own monetary policy i.e. the ability to set their own interest rates and money supply. This is often a condition that independant states value as it allows them to react directly to national business cycle problems. For instance, if they are experiencing a downturn a cut in the base rate will inject some form of stimulus into the economy. The loss of this type of policy response freedom is one of the main restraints stopping countries like the UK from joining a currency union such as the euro.


Monetary policy committee

Is a Bank of England committee that is responsible for agreeing monetary policy in the UK. It includes 8 members including the Governor of the Bank of England. Each member has one vote. The committee is often abbreviated to the MPC.

The structure and organisation of the MPC is shown below.


Money

Is a system of coins, notes and records that facilitates economic activity by providing a unit of account, a medium of exchange and a store of value.

Money Markets

Organise the provision of short-term debt to individuals, firms, banks, the government and other financial institutions. Term of debt typically varies from 24 hours to 12 months, highly liquid and can be bought and sold in any size denomination. Some of the most commonly traded instruments include government bonds and Certificates of Deposit.


Money supply

The supply of monetary assets available in an economy at any point in time. It includes coins and notes and deposits held by banks. Due to modern advances most of the money supply is accounted for by deposits at banks.

Money wage rates

The wage rate without adjustment for inflation.

Monopolistic Competition

Is a market structure that contains a large number of firms selling differentiated versions of a product. As all firms sell differentiated versions of the product being sold, this market structure combines elements from a monopoly and a perfectly competitive market and is therefore classed as a form of imperfect competition. 

The main assumptions that are required for a market to be classed as monopolistically competitive are as follows:

  1. Large number of buyers (consumers) and sellers (firms) - this ensures that a large number of substitutes for the good are being produced. 
  2. Perfect Information - consumers have the ability to assess each product and carry out price comparisons between rival firms. 
  3. No barriers to entry or exit - any firm can enter the market to enjoy profits as there are no barriers of entry present. However, firms can also freely leave the market costlessly if they are making a loss due to no barriers to exit being present. It is this assumption of freedom of entry and exit which means that firms in this type of market structure will always make normal profits in the long-run. 
  4. Firms produce differentiated products - this means that firms can effectively become price makers of their own version of the product, especially if the degree of product differentiation is significant.

If firms operate in a market where all of these conditions are met, it creates an environment of monopolistic competition. This type of market structure is often the most useful from a practical point of view as there are many examples of high-street shops that compete in this way. For instance, the fast food market is an example of a cluster of firms that compete in this way. This is because all firms offer a similar convenient cheap service but offer subtle differences in their service, in order to attract different types of customers, such as: providing different items on the menu, branding and advertising their products in a unique way and designing and planning the interior of their restaurants differently.

Product differentiation is the key feature of this market, as by doing so allows firms to compete for consumers in terms of the quality and individuality of their product rather than just on price. The main aspects of product differentiation available to firms are:

  • Branding
  • Packaging
  • Quality
  • Customer Service
  • Extra Features
  • Skill and Efficiency of Staff

The fact that these firms  differentiate their products slightly means that brand loyalty is created amongst their consumers and therefore they face a downward sloping demand curve (AR) rather than the perfectly elastic demand curve under perfect competition. This means that firms can charge higher prices without losing all of their customers - unlike in the perfectly competitive case. But as they still face some close competition from other firms, the demand curve is not equal to the market demand curve, like in the case of a monopoly. The downward sloping demand curve means that if firms wish to sell a higher quantity of the good then they must charge a lower price to do so.

As usual, firms in the market profit maximise where MR=MC and due to the fact that they have some market power as a result of product differentiation, the price that they charge is represented by the price they can set according to the demand curve for that specific quantity of goods. As this price is predominantly above the average cost of production, firms can make supernormal profits. However, it is important to note that supernormal profits are not always achieved n the short-run, as the ability to make profit in the shot-run depends on the position of the firm's average cost curve. This means firms can also make normal profit or economic losses in the short-run as well. The three possible short-run outcomes for firms is shown below:

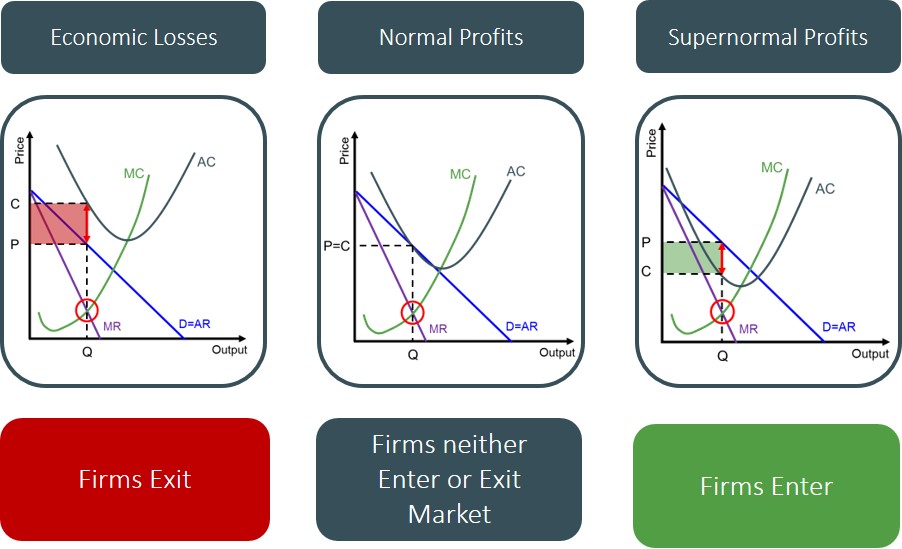
However, these outcomes only theoretically hold in the short-run as a result of the assumption of no barriers to entry or exit in the market.

In the case of supernormal profits being made in the short-run, this is eliminated in the long-run because firms outside of the market are incentivised to join and produce because of the attraction of jointly earning supernormal profits. However, as there are only a limited amount of customers in the market, the greater the number of firms in the market, the more diluted the customer base for each incumbent firm becomes. This as a result causes the demand curve and marginal revenue curves to shift inwards, until only normal profits are earned by all firms in the market in the long-run.

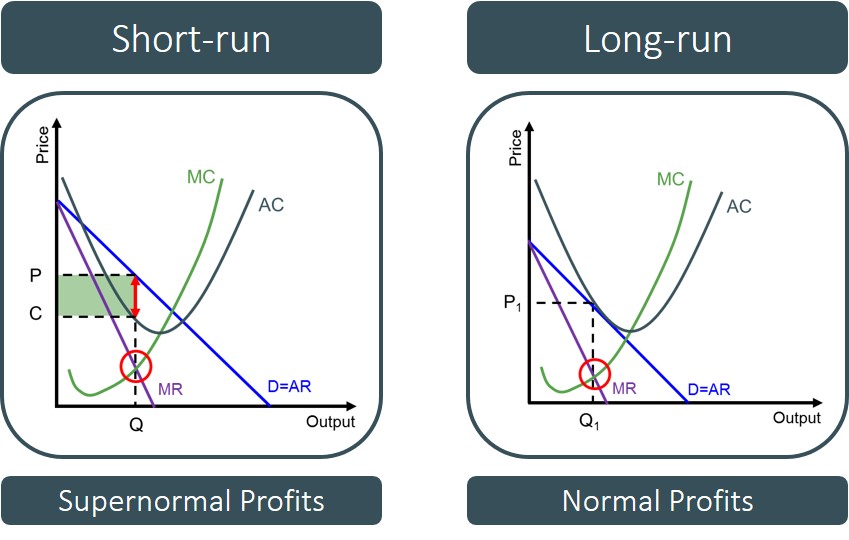
The opposite process occurs if firms are making economic losses in the short-run.

When it comes to evaluating monopolistic competition, it is all about assessing the efficiency implications of the market structure and do that we can use the theoretical benchmark of perfect competition. 

First of all, productive efficiency is not achieved under this type of market structure as firms do not produce at the minimum of the average cost curve. This is the case in both the short-run and long-run as firms produce at a higher cost when maximising profits. This leads to efficiency and welfare losses that are achieved under a perfectly competitive market structure. 

In terms of allocative efficiency, firms in this market structure do not produce where the price is equal to the marginal cost (P=MC). This is because the product differentiation has allowed them to become price makers and therefore can set a price above the marginal cost, to the point specified by the demand curve. This means that compared to a perfectly competitive market, an optimal allocation of resources is not met and as a result a dead weight loss triangle is created in the process. This means that total welfare is higher under perfect competition. 

In terms of assessing the market structure for dynamic efficiency and X-efficiency, it all depends on the extent of product differentiation in the market. This is because the degree of product differentiation determines the level and type of competition between firms.

If a product becomes highly differentiated from other products, it effectively becomes a new product on the market. This essentially means that firms have insulated them from any direct competition as there are no close substitutes available. By doing so,  the firm has transitioned into a new niche market of which they are the only real providers of this type of good. Doing so, means they start to develop the characteristics of a monopoly and can now engage in setting their own prices without having to take into account the reaction of rival firms, as consumers demonstrate brand loyalty towards this differentiated good and on that basis are willing to pay more for that particular brand. The welfare implications are such that when significant product differentiation takes place, a wide range of products are created for consumers to choose from, which creates more opportunities for them. However, the fact that it could create a specific niche market means that the market may suffer from some of the inefficiencies and welfare losses of a monopoly, which incidentally are more significant than when competing under monopolistic competition. This factor alone could erode away the extra benefits consumers gain from having a wider range of product lines available to them. 

On the other hand, if product differentiation is slight, then firms will still have to compete with lots of close substitutes in the market, as the differentiation is not significant enough to distance away from rival products. This encourages firms to have to engage in non-price competition, as price competition could lead to a price war. This though can create dynamic efficiency and X-efficiency as firms need to compete to provide the best product and service in order to convince consumers to buy their version of the product. This in itself, can help drive up the standards of all firms involved by encouraging product innovations (dynamic efficiency). However, this form of dynamic efficiency only occurs if firms use any supernormal profits made in the short-run to pay for research and development projects. Doing so may present firms with an opportunity to become more efficient over time and make supernormal profits in the long run as well.  


Monopoly

A market structure where there exists just one seller of a particular good. This market structure is the opposite of a perfectly competitive market.

The assumptions that are required for a monopoly to hold are as follows:

  1. A single firm controls the output of the entire industry - this ensures that this firm is a price maker and sets the price that maximises their profits.
  2. There are significant barriers to entry - the presence of these barriers ensures that the monopoly power of the firm is protected, as no other firm can enter the industry.

If a firm operates in an industry where these conditions are met it creates a monopoly market structure. However, a monopoly is more of a theoretical market structure as there are very few practical examples of one firm controlling an entire market (pure monopoly). Often the theory of a monopoly is important to assess the impact of one large firm dominating several small firms. 

Just like under monopolistic competition, the monopolist faces a downward sloping demand curve (AR) as they are the only seller in this particular market, rather than the perfectly elastic demand curve under perfect competition. However, in the case of the monopolist, this is also the market demand curve as this is the only firm supplying this type of product to the market. It is this unique feature in monopoly markets that grants the monopolist a large degree of monopoly power. The monopolist profit maximises at the point where MR=MC, but because of the significant monopoly power, the price that they charge is represented by the price they can set according to the demand curve for that specific quantity of goods. The monopolist can do this because the monopoly power makes them a price maker. Because of the fact that the AR curve is higher than the AC curve for the monopolist at this point, it creates the conditions for the monopolist to extract supernormal profits from the market. In the long-run the monopolist outcome is unchanged as the presence of significant barriers to entry prevent new competitors from joining the market and stealing the supernormal profits available.


It is important to consider that this outcome is all based on the assumption that there exists significant barriers to entry in the market for the situation of supernormal profits to hold in the long-run.

However, the level of supernormal profits a monopolist receives will be subject to changes in market conditions such as the level of demand for the good. For instance, monopolists are price makers and therefore set their own prices and the demand curve determines how much output will be sold on the market at that price. A monopolist does not have the ability to set both the price and quantity of output. If the demand curve shifts inwards or the average costs of production for a firm increase, then this will reduce the level of supernormal profits belonging to the monopolist. If market conditions go against that of a monopolist and causes the firm to make economic losses in the short-run, then in the long-run the firm will leave the market and as the firm is the only firm in the market, the market will cease to exist in the long-run. This means that monopolists have to adhere to the standard shut-down points of all other firms. 

An interesting analytical point to raise when talking about monopolies is the comparison against a perfectly competitive market structure. This is because a monopoly is at the opposite end of the market structure spectrum when compared to perfect competition. When compared to this market structure the market equilibrium is more inefficient and results in lower welfare than compared to a perfectly competitive market because of the fact that monopolists are price makers. The optimal output level for monopolists is below that of a perfectly competitive market, as they set a higher price to maximise profits. As a result, this means that producer surplus increases because of the higher price and consumer surplus decreases due to the higher price. However, as the loss of consumer surplus is larger than the gain in producer surplus, there is an overall dead weight loss triangle created. Under a perfectly competitive market, social welfare is maximised as a result of producing at the point of allocative efficiency. Therefore monopolists reduce the overall level of social welfare in the economy, which is often why they are perceived as bad for an industry.  

In terms of efficiency, monopolies are both allocatively and productively inefficient. It is productively inefficient because the monopolist does not produce at the minimum of the average cost curve. This is because the monopolist profit maximises and that production point corresponds to an average cost that is above the minimum, resulting in productive inefficiency. As for allocative efficiency, the monopolist has significant monopoly power, so it sets a price above the marginal cost and the allocative efficiency condition of P=MC is not met. 

However, the question over whether a monopoly leads to dynamic efficiency is uncertain. The answer to this question identifies whether a monopoly market structure is better or worse than perfect competition and this is the key evaluation point to mention regarding monopolies. The reason for the uncertainty, is it all depends on what type of industry the monopolist operates in (the scope and importance of innovation and invention in the market) and whether dynamic efficiency can be easily achieved and whether from the monopolists perspective it is rewarding to invest and innovate.

For instance, the monopolist may be more dynamically efficient than perfectly competitive markets, if the monopolist uses the supernormal profits made in the short and long-run to invest research and development projects. By doing so, this will encourage innovation and invention into the production process, create X-efficiencies and improve the productively efficient point for the firm. In terms of the impact on a modern developed economy, if sustained it will increase the productive capacity of the economy and may even encourage other firms to become more dynamically efficient. This is most likely to be the case in industries where innovation and invention is required to continue to yield profitable results for the monopolist i.e. technology driven industries such as the upcoming driver less car market.

However, there is a fear that monopolists may be encouraged reap the supernormal profits made and without the fear of new competition coming in, divert those profits as dividends to investors and shareholders, increasing the shareholder return on the company instead of investing in research and development projects. The monopolist can do this because of the presence of significant barriers to entry. If this is the case then the market becomes dynamically inefficient and the outcome is worse than perfect competition. This occurs in industries where the rewards for innovation and invention are minimal e.g. service providers such as barber shops.

Despite all these problems with a monopolist, there may well be an advantageous case for one firm to control the entire infrastructure of an industry, as some markets involve significant initial infrastructure costs which would be unnecessary to duplicate. Therefore, to avoid these costs it is beneficial for the market to become a monopoly. This allows the monopolist to take advantage of the large economies of scale present, than have lots of smaller firms inefficiently compete over the market, raising costs and prices in the process. This is an example of a natural monopoly.


Monopoly Power

The ability of a single firm to influence an entire market. In this type of market structure monopoly power allows the monopolist to restrict output and become price makers i.e. price above the marginal cost.


Monopsony

This is a type of market structure where just one dominant buyer exists and there are many sellers.

Most common form of monopsony is the sole buyer of labour with many workers supplying their labour at a given wage rate e.g. the government employing workers for public services. Below is a diagram to illustarte the market structure of a monopsony in the labour market. The most striking part of this diagram is the increasing marginal cost curve for labour that these types of firms face. This is because as the firm is only employer of labour in this market if they wish to hire additional workers they have to offer higher wages but not only do they have to pay the new employee the higher wage but all the other existing workers wages will need to be increased as well.


Monopsony Power

The ability of a large buyer to influence the market outcome in a monopsony market structure. For instance the government is a major buyer in industries like the NHS and therefore have control of the wages paid to all those workers as they face very little competition from other buyers.


Monotonicity

This is the feature of consumer preferences that says 'more is always better' i.e. consumers will always receive more utility from consuming two chocolate bars rather than one, provided they like consuming chocolate bars. This preference helps explain why consumers continually prefer to buy goods in large quantities reguarly.


Moral hazard

People who are covered by an insurance policy are likely to exercise less care and attention than people who aren’t covered.

Mortgage

A loan taken out to buy a property with the property title deed (a legal document that confirms who owns the property) transferred to the lender and retained as security until the loan and any interest are repaid in full.

Multiplier effect

The process by which expenditure generates a trail of subsequent expenditure so that the resultant change in national income will exceed the amount initially expended.

Below is a diagram to show how the mulitplier effect in an a economy is realised. For instance if there was an increase in investment from a firm to increase the size of the office by £1million, this would lead to a greater than £1million increase in aggregate demand due to the multiplier. Firstly that £1million would go to the building company in charge of expanding the office, who would then use that money to pay for the nominal wages of the individual builders in charge of the project. This would then make up part of worker's disposable income and this would be spent on consumer goods such as food and clothes. All this extra spending would contribute towards a higher level of national income.


Narrow money

A measure of money supply based on the total notes and coins in circulation i.e. cash. This is refereed to as M0 and was circa £60 billion in 2013 (circa 3% of broad money).

Nash Equilibrium

Is a strategy profile such that every player's strategy is a best response to the strategies of all the other players. In a Nash Equilibrium no player can unilaterally deviate to obtain more profits. However there are some games in which have either no Nash Equilibrium or multiple nash equilibria.

Below is a 2x2 payoff matrix and the equilibrium concept to this game. In this instance both players are playing their best response at (Defect, Defect). For more information on this game and how it's solved see the Prisoners' Dilemma Game.


National debt

The amount of money borrowed by the Government by issuing Gilt Edged Securities.

Below is a table to show the level of UK national debt that has been accumlated as the government has been running a large budget deficit.


National income or output

The total value of goods and services in an economy over a given period of time. This can measured in a number of different ways e.g. GDP, GNP , etc. There are three approaches to obtaining the value of goods and services -expenditure, income or output.

Nationalisation

Where a government acquires complete ownership of a firm or industry e.g. education, healthcare, roads.

Natural monopoly

A market where there is only room for one firm to operate due to substantial capital requirements or 100% ownership of a key resource. There are very few remaining examples in the UK due to the break up and privatisation of state monopolies since WW2. It an also be graphically represented by the minimum efficient scale being large relative to the size of the market and therefore only one firm to be able to reach the MES.

Below is a diagram to show how a natural monopoly rises in a market. In this instance only one firm is able to reach the MES point to fully exploit all the economies of scale in the market. To break up this natural monopoly, more competition needs to be added. But with that extra competition comes higher average costs, reduced average costs and as a result higher prices for consumers as the diagram shows. So in many cases a natural monopoly is often beneficial for a market from both consumers and producers point of view.


Natural rate of unemployment

The lowest rate of unemployment that can be sustained without increasing inflation and therefore the rate of unemployment when the labour market is in equilibrium. This type of unemployment can be calculated by adding together the level of structurally and frictionally unemployed workers in the economy at a point in time (supply-side types of unemployment).

Below is a diagram to illustrate the level of the NRU in an economy. As can be seen the NRU is the difference between those who would like a job at the current prevailing wage rate and those who are willing to take a job.


Needs

The basic requirements for survival e.g. food, shelter, warmth, protection, healthcare.

Negative consumption externalities

Costs arising from the consumption of a good or service that are experienced by third parties e.g. noise disturbance, injuries requiring treatment and animal distress associated with consumption of fireworks.

These types of externalities are produced due to the over-consumption of a demerit good.

This is because the over-consumption creates a divergence between the marginal private benefit and the marginal social benefit curves. This is because consumers do not take into account the negative effects on society of consuming this good e.g. second hand smoke when smoking a cigarette. The external cost that is released onto society is represented by the dead weight loss triangle below. 

This type of externality can be internalised via government interventions such as: indirect taxes, educational policies and product bans.


Negative expectations

When the future outlook for economic variables is negative e.g, interest rates will rise and economic growth will slow.

Negative externalities

Are negative costs and benefits that are incurred or experienced by third parties.

Negative externality

A negative cost or benefits that are incurred or experienced by third parties.

Negative output gap

When actual GDP is less than the value of GDP if it had grown consistently in line with the trend rate of growth. Normally characterised by falling real output and slowing inflation.

Below is a diagram to illustrate when real output falls below the full employment level and therefore the economy has a high level of spare capacity.


Negative production externalities

Costs arising from the production of a good or service that are imposed onto third parties e.g. the pollution associated with oil extraction.

Below is a diagram to show a negative production externality that is being imposed on third parties. This is created because of a divergence between the marginal private cost and marginal social cost curves i.e. individual producers do not realise the negative externality they are releasing onto society and therefore they over-produce the good. This leads to the level of output produced to be above the socially optimal level and ultimately this leads to market failure. The deadweight loss triangle represents the size of the externality in the market.

When evaluating policies that governments could implement on the market to correct this type of market failure, it is important to consider the size of the externality. The larger the externality in the market, the more incentive there will be for governments to intervene in the market, as the larger externality the greater the impact on society's welfare. However, for governments to correct the market failure, they need to calculate how large the production externality may be. It is almost impossible for governments to accurately quantify the size of the externality in the market and therefore this means government intervention can be an imperfect measure to internalise the externality and as a result government failure could arise. 


Nominal GDP

A measure of economic activity that has not been adjusted for inflation.

Below is a chart to show the level of nominal GDP for the UK and how it has evolved over time. The problem with this measure compared to real GDP is that it does not give a true reflection of economic activity as it includes price rises as well as output changes. Therefore it will often overstate the value of a country's economy. 


Nominal value

The money value of a variable without adjustment for inflation.


Non pure public good

These are typically goods that have the feel of public goods but do not completely satisfy the definition of a public good. They are largely non-rival (apart from during peak/times and periods) and although it is possible to exclude third parties from the benefits the costs associated with this mean that this is rarely enforced. e.g. roads and NHS.

Below is a digram to illustrate that for a public good to be classed as non-pure there must be one characteristic of a public good that does not hold. Below are examples of two goods toll roads and a popular beach. A toll road is non-rival as there is plenty of room for cars on these types of roads consumptin of this type of good has little or no effect on the amount left for others to consume. But of course this good is excludable because unless a person wishes to pay the toll to use the road they cannot enojy the good i.e. this is not a good that people can free-ride off. On the other hand a popular beach is non-excludable as it is free to use a beach, but is a rivalled good as the more people that use the beach the less space there is for the next consumer on that beach.


Non pure public goods

These are typically goods that have the feel of pur public goods but do not completely satisfy the definition. They are largely non-rival (apart from during peak/times and periods) and although it is possible to exclude third parties from the benefits the costs associated with this mean that this is rarely enforced. e.g. roads and NHS.

Below is a digram to illustrate that for a public good to be classed as non-pure there must be one characteristic of a public good that does not hold. Below are examples of two goods toll roads and a popular beach. A toll road is non-rival as there is plenty of room for cars on these types of roads consumptin of this type of good has little or no effect on the amount left for others to consume. But of course this good is excludable because unless a person wishes to pay the toll to use the road they cannot enojy the good i.e. this is not a good that people can free-ride off. On the other hand a popular beach is non-excludable as it is free to use a beach, but is a rivalled good as the more people that use the beach the less space there is for the next consumer on that beach.


Non renewable resource

A resource that cannot be replaced after it has been used e.g. oil and gold.

Non-durable goods

Goods that can only be consumed on a single occasion and cannot be repeatedly used e.g. food or drink.

Non-Performing Loan (NPL)

Is when a counterparty in a financial transaction fails to meet the obligations set aside in a loan contract by failing to pay the principal of the loan or the accompanying interest payments. NPLs are norally an indicator of how badly the bank is performing and therefore how exposed to risks and losses it is. However, what is classed as an NPL greatly depends on the location of the bank used. According to the BASLE Capital Accord “A loan is nonperforming when payments of interest and principal are past due by 90 days or more."


Non-Price Competition

This is when firms engage in efforts other than reducing prices to attract consumers. This is because normally firms in an oligopoly face a kinked-demand curve, in which reducing prices will not allow oligopolists to capture the entire market. Therefore by distinguishing their product from rival's they will be able to set the profit maximising price without the fear of retaliation from rivals.

Below is an expample of how the chocolate maker Cadbury's tries to distinguish itself from a heavily saturated market without becoming embroiled in a destructive price war. It has a three-tiered system where the products must be visually and functinally different from other chocolate bars on the market As well as an alternative form of branding and service provision.


Normal capacity

The full employment level of real output identified by the position of the vertical LRAS curve.

Below is a diagram to ilustrate this point for an economy. This is the point at which an economy is on track to achieve its potential growth as all resources in the economy are being utilised.


Normal good

The demand for this type of good increases as income rises. The opposite of an inferior good.

Below is a diagram to show the demand curve for a normal good and how the demand curve changes to changes in income. If the real income increases this causes the demand for normal goods to rise, this is because consumers have a large amount of income to buy the goods that they wish to purchase. A decrease in real income will cause the demand curve to shift in as consumers have to switch to inferior goods as their ability to purchase normal goods is reduced.


Normal goods

The demand for this type of good increases as income rises. The opposite of an inferior good.

Below is a diagram to show the demand curve for a normal good and how the demand curve changes to changes in income. If the real income increases this causes the demand for normal goods to rise, this is because consumers have a large amount of income to buy the goods that they wish to purchase. A decrease in real income will cause the demand curve to shift in as consumers have to switch to inferior goods as their ability to purchase normal goods is reduced.


Normal profit

When the difference between a firm's total revenue and total cost is equal to zero. Therefore, this is the minimum level of profit needed for a company to remain competitive in the market.

The diagram below shows how an individual firm breaks even by charging a price equal to their average cost of production and therefore firm's do not get to enjoy any supernormal profit.


Normative statement

A statement concerning an economic issue that is based on a value judgement rather than factual evidence. Such statements are simply matters of opinion and cannot be proven or disproved.

Nudges

A small action taken by the government to try and nudge people towards a certain course of action. Therefore this concept argues that positive reinforcement and indirect suggestions to try to achieve non-forced compliance can influence the motives, incentives and decision making of groups and individuals, at least as effectively – if not more effectively – than direct instruction, legislation, or enforcement.


Objective Judgements

A judgement based on facts rather than opinions.


Ofcom

The independent regulator and competition authority for the UK communications industries.

Office for Budget Responsibility

The Office for Budget Responsibility (OBR) was created in 2010 to provide independent and authoritative forecasts and analysis of the UK’s economy and public finances.

Oligopoly

A market structure that contains only a small number of large dominant firms. This market structure is a form of imperfect competition and oligopolies can come in a variety of different forms:

  • Pure Oligopoly - Small number of firms control the entire market
  • Realistic Oligopoly - Several large firms dominating a market
  • Duopoly - Two firms dominating a market

Oligopolistic markets are defined in terms of market structure and market conduct. The market structure element relates to the number of firms in the market, the extent of barriers to entry in the market and the degree of interdependence in the market. The market conduct element refers to the strategies that oligopolistic firms decide to take i.e. will firms engage in competitive pricing strategies or collusive strategies.

The main characteristics of an oligopoly market structure are as follows:

  • Small Number of Large Firms - Oligopolistic markets tend to have large firms controlling most but not all of the market. The measure of dominance from a select group of firms can be measured via an n-firm concentration ratio e.g. 4-firm concentration ratio in the UK Supermarkets Industry.
  • High Barriers to Entry - High barriers prevent new firms from entering and stealing the supernormal profits made by the incumbents and allows firms to continue to earn supernormal profits in the long-run. This is a characteristic similar to a monopoly market structure. These barriers to entry are either naturally formed or artificially created by incumbents. The artificial barriers to entry include: predatory pricing, non-price competition, branding, advertising and integration. 
  • Firm Interdependence - The market outcomes for firms depend not only on their own decisions but also upon other firms' decisions. This means that the profit that firms make depends on the strategies of rival firms. This characteristic can be represented via game theory. 

From a practical point of view, an oligopoly market structure can be applied to many industries within an economy and can help explain some of the decision-making processes by firms. However, unlike in the case with perfect competition and monopoly, the theory of how oligopolies behave and act is not a definitive one. This is because the market outcomes of an oligopoly all depend greatly upon individual circumstances. This is why there are many different competing theories which seek to explain how oligopolists behave in the market and how the market equilibrium is reached (e.g. the kinked demand curve model).

The market outcomes reached can range from competitive pricing strategies (perfect competition) to non-competitive pricing strategies (monopoly). In a competitive oligopoly, each firm pursues their own strategy (pricing strategy) but the optimal strategy they take depends on the expected strategy of rival firms at the same time. Therefore, when oligopolist firms are competing amongst each other, price wars are often the outcome. Under this type of strategy, the oligopoly outcome mirrors that of a perfectly competitive one because in the long-run firms force the market price down until only normal profits are made. At this point if firms' cut price any further it will cause them to make economic losses, so the market price remains where firms make only normal profits. This matches the same outcome under perfect competition. From a welfare point of view, whilst prices are good for consumers, they are not optimal for oligopoly firms, as supernormal profits are wiped out by destructively low prices. 

However, an oligopoly may not lead to this market outcome, as long as each firm can resist the temptation to start a price war. For instance, firms may use pricing strategies to re-inforce barriers to entry already in place and protect long-run supernormal profits. This strategy is created by firms engaging in non-competitive pricing strategies such as collusion. Under this type of strategy the monopoly market outcome is reached in the long-run as firms make supernromal profits. The strategy works via existing firms co-operating together to maintain a high market price. Therefore, collusion may benefit all firms by enabling them to earn supernormal profits, providing no firm has the incentive to cheat to increase their own share of supernormal profits.


OPEC

Organisation of Petroleum Exporting Countries. It controls petroleum prices by agreeing fixed production quotas.

Open economy

An economy that trades goods and services with other countries.

Opportunity cost

The benefit associated with the next best alternative to the action actually taken e.g. If a consumer decides to spend £25 on a night out instead of buying an EzyEducation Multiplier package the opportunity cost is that they will not have access to some useful learning support.

Organic Growth

Organic growth is the process of business expansion by increased output, customer base expansion, or new product development, as opposed to mergers and acquisitions, which is external growth.


Output

The quantity of goods and services produced by a productive process.


Output gap

The difference between actual GDP growth and the trend rate of GDP growth for an economy. The gap can be positive or negative.

Below is a set of diagrams to show how a positive and negative output gap emerges in an economy in a AD-AS framework.


Over production

When the market produces more than the market requires leading to excess supply.


Over-heating

This is a period of economic activity when AD exceeds the productive capacity of an economy and is characterised by high levels of growth and accelerating inflation without any sustainable extension in real output.

Overt Collusion

This is a type of collusion in which formal and explicit co-operation and agreements take place between rival firms. This type of collusion normally leads to a cartel forming amongst firms.

The diagram below shows the individual and market outcome of this form of collusion. In this instance, if all firms charge a price of P, ths leads to all firms producing a fixed quota of goods making a level of supernormal profit equal to the red shaded box below. Therefore, this ensures that industry profits are maximised.


Owner occupied

A phrase used to describe a property that is occupied by the person that owns it.

Pareto efficient point

The best outcome that can be achieved e.g. any point on a PPF, the lowest point on an AC curve, the equilibrium point an a demand/supply graph.

Partial market failure

A market exists but too much or too little of a good or service is produced.

Partial model

A model that explains economic activity using a small number of variables.

Patent

A patent provides an inventor the exclusive right to produce a good or service for a certain period subject to full disclosure of the invention. This establishes monopoly powers for the duration of the patent.

Patents

A patent provides an inventor the exclusive right to produce a good or service for a certain period subject to full disclosure of the invention. This establishes monopoly powers for the duration of the patent.

Payoff Interdependency

Is where the payoffs acruing to each action for players' involved in a game are dependant on the actions of the other players' in the game. for example a firm deciding to set its price must take into account the price reactions of all other related firms in the market until they can analyse the profit that will result from this price change. This is why game theory is so crucial to analysing how oligopoly markets work - as these markets have a high degree of interdependency.


Payoff(s)

Is a term used in game theory to illustrate players' preferences over the outcomes available to them in the game. Payoffs normally represent the utility to consumers or profit to businesses of playing a particular action in the game. Clearly players wish to maximise this payoff to meet their objectives of profit or utility maximisation.

Below is a payoff matix to illustrate the breakdown of supermarkets payoffs corresponding to pricing decisions in terms of the profit they will receive.


Pegged Exchange Rate

When an exchange rate is fixed relative to another currency.


Pension Fund

A fund established by an employer to facilitate and organise the investment of employees' retirement funds contributed by the employer and employees. The pension fund is a common asset pool meant to generate stable growth over the long-term, and provide pensions for employees when they reach the end of their working years and start retirement. 


Percentage change

Is a mathematical way of measuring the difference in values expressed in percentage form. These are predominantly used to emphasise significant changes in data in a clear form. 


Perfect competition

Is a market structure that describes the conditions required for intense competition to take place amongst firms in an market. This market structure is a contrast to a monopoly market. 

The assumptions that are required for perfect competition to hold are as follows:

  1. Large number of buyers and sellers in the market.
  2. No individual firm has significant market power to influence the market price - this outcome means that all firms are price takers and have to sell at the prevailing market price.
  3. All firms sell a homogeneous products - the products that firms are selling are identical in terms of their product characteristics. This creates a horizontal (perfectly elastic) demand curve as all products that firms produce and sell are perfect substitutes for each other.
  4. Freedom of firms to enter and exit a market - any firm can enter the market to enjoy profits as there are no barriers of entry present. However, firms can also freely leave the market costlessly if they are making a loss due to no barriers to exit being present. It is this assumption of freedom of entry and exit which means firms in this type of market structure will always make normal profits in the long-run.
  5. Perfect knowledge available to all firms - sellers have perfect knowledge regarding their competitors and possible technological improvements available to the market and consumers have perfect knowledge of all firms prices and therefore will never buy the good at a higher price than at the market price. This assumption reinforces the prevailing market price that all firms must 'take'.   
  6. Perfect mobility of factors of production - factors (e.g. labour and capital) can move from one production process to another to help complete different types of work. 

If firms operate in a market where all of these conditions are met it creates an environment of perfect competition. However, perfect competition is often discussed as being just a theoretical model of competition as a result of the unrealistic assumptions that are required to hold e.g. can a market ever have a situation of perfect knowledge across all firms and consumers?

Therefore, despite having a minimal role in terms of practical application, this model of competition is used as a comparison tool against other and more inefficient market structures such as a monopoly or oligopoly. This is because perfect competition leads to an efficient outcome in the long run in which social welfare is maximised, due to firms producing at the point that is allocatively and productively efficient. Therefore, the theory of perfect competition is a good evaluative tool in itself to use as a benchmark to assess the market outcomes from other types of market structure. 

A perfectly competitive firms demand curve is perfectly elastic (horizontal) at the prevailing market price, this means two things. First of all the firm can sell as a high quantity of the product they are producing as they want, without impacting the market price. But, the firm has to sell the quantity at the market price otherwise the demand for their product drops to zero. This is because consumers have perfect knowledge about other alternative sellers prices and will always buy the same product from the cheapest possible location. 

However, when graphically representing the perfect competition market structure for individual firms and the market in general it is important to consider the time horizon that firms are operating in. This is because the efficient outcome of perfect competition is only guaranteed in the long-run. In the short-run, firms produce at the profit maximisation point (P=MC), which can either be above, below or equal to the average cost of production. This means that firms can be making supernormal profit, normal profit or an economic loss in the short-run.

Whether a firm makes a profit or not in the short-run all depends on the type of market that the firm is operating in, the position of the firms average cost curve and the market price that prevails.

However, in the long-run all firms operating in a perfectly competitive market will make normal profits because of the fact that firms can freely enter and exit the market. For instance, if firms are making a profit in the short-run then this triggers firms that are not currently producing in the market to enter as the presence of supernormal profits lures and incentivises them to start producing. However, the decision for firms to enter increases the supply of goods produced in that market and without an accompanying equal change in demand, this creates excess supply in the market. The excess supply causes the price of the good to fall and as the price determines the position of the perfectly elastic demand curve firms face, this causes the profit maximisation point to fall closer to the average cost of production (which are assumed unchanged). This process of moving down a firms marginal revenue curve causes the amount of profits accruing to each firm to fall. Firms keep entering the market until eventually all supernormal profits have been eliminated and all firms are producing at the minimum of the average cost curve, signalling normal profits. This means all transactions will take place at the market equilibrium price and total output/consumption will be at the market equilibrium level. Below is an example of this market adjustment:

This process works in reverse if in the short-run firms were making an economic loss - firms are incentivised to leave to minimise their losses. In the case of normal profits being made in the short-run no change is made to the market.

This means the result of all firms in the long-run under perfect competition are shown below:

This outcome is the most efficient market equilibrium that can be achieved because of the fact that there is no deadweight loss triangle present unlike in other market structures e.g. a monopoly. 

It creates the most efficient outcome because firms that operate in a perfectly competitive market are classed as productively efficient in the long-run as they end up making normal profits and producing at the minimum of the average cost curve. 

Also most firms can be classed as allocatively efficient in the long-run as firms produce at the point where P=MC. However, this only holds if firms are producing in a market with no externalities present. This is because when there are externalities present, private costs and benefits do not equate to social costs and benefits. If the marginal social benefit and costs do not equate then this means that consumer and producer surplus cannot be maximised and this means there must be a better allocation of resources available in the market.

However, despite perfect competition providing efficient results, one type of efficiency that is not achieved is dynamic efficiency. This is because in order for firms to be incentivised to achieve dynamic efficiency they need to make supernormal profit to enable them to undertake the investment required for the research and development needed to innovate the production process. It is unlikely that this will be achieved in perfect competition because the assumption of perfect knowledge across all firms means that firms can just replicate any new products or new techniques developed in the production process, removing any competitive/cost advantage this type of investment is meant to develop. Also the fact that firms cannot make supernormal profit in the long run means that they will never be in a position to be able to protect the advantages of their investment and will not be encourage to make the changes required. The fact that dynamic efficiency is not achieved creates wider implications for the economy because it is investment that drives the long-run trend growth rate and therefore if investment is stunted because of this form of competition, long-run growth will be permanently revised at a lower level. 

The final point to mention regarding perfect competition is the theoretical model can be used as a yardstick to compare other market structures against. This is because in reality industries are never really perfectly competitive, but by relaxing some of the assumptions of perfect competition it may mirror some types of market structures (e.g. monopolistic competition) and therefore allow us to asses and evaluate those markets. For instance, the closer an industry is to perfect competition, the closer it is to the efficiency results which fosters improved services and products. 


Perfect information

When buyers and sellers have complete information concerning factors that could influence decisions to buy and how to produce a good i.e. prices and quantities for sale, how to make the goods and the most efficient production techniques.

Below is a graphic to highlight the main factors that have to hold for agents to have full and complete information about the market.


Perfect knowledge

When buyers and sellers have complete knowledge concerning factors that could influence decisions to buy and how to produce a good i.e. prices and quantities for sale, how to make the goods and the most efficient production techniques.

Perfectly elastic demand

Is a term used to relate to goods that have a price elasticity of demand value of infinity. This essentially means that the quantity demanded by consumers for these types of goods depends severely on the market price i.e. if the price increases or decreases this will cause demand to collapse to zero for this good. This is normally a result of their being a large number of perfect substitutes available in the market. 

We can represent a good that has a perfectly elastic demand curve as a demand curve that is horizontal at the market price. This is shown below:

Any amount of a good can be demanded at or below the price level contained in the demand curve while there will be no demand for the good at a higher price. As demand cannot be determined the price elasticity of demand is infinite. Price elasticity of demand is also infinite at the point where demand is zero.


Perfectly elastic supply

Refers to goods that have a price elasticity of supply value equal to infinity. This essentially means that any amount of a good will be supplied at the prevailing price, but nothing is supplied below this prevailing price. 

This is shown in the diagram below:

perfectly elastic supply diagram

So in this case if the price falls to P2 (even with a small price fall) the quantity supplied by the firm will instantly drop to zero. This is normally a theoretical application of PES to supply curves.


Perfectly Inelastic Demand

Is a term used to relate to a good that has a price elasticity of demand value of 0. This essentially means that the quantity demanded by consumers for this good does not depend on the price of the good i.e. consumers will demand the same quantity of the good at every possible price.

We can represent a perfectly inelastic demand curve via a vertical demand curve as shown below:

For this demand curve the PED values are equal to 0 at all points and therefore changes to prices have no effect on quantity demanded e.g. diabetic patients demand for insulin.

Perfectly inelastic demand also arises if the price of a good is zero and quantity demanded is at its maximum possible level. However, this is only of theoretical significance as even a 1p rise in price will mean that elasticity rises above this level.


Perfectly Inelastic Supply

This refers to when only one quantity of a good can be supplied at any given price. As a result this means the price elasticity of supply (PES) value is equal to 0.

The shape of a perfectly inelastic supply curve is shown below:

The supply curve is vertical at the specific quantity supplied of Qs. This curve highlights that any change in price does not cause a change in the quantity supplied. It is very rare for firms to face an inelastic supply curve as traditionally firms will always supply more when the price of the good they are supplying increases. An example of this might be the UK property market as demand has been outstripping demand, forcing house prices up. This is particularly the case in areas such as London where it is almost impossible to find new land to build properties. Which is an explanation over why house prices are so much expensive in this area. 


Permanent income

The amount of income a household could spend over its lifetime without reducing the value of its assets e.g. dividends on shares or interest on deposits.

Phillips Curve

The Phillips Curve is an economic model that illustrates a stable inverse relationship between the inflation rate and the unemployment rate. It is used to show policymakers that there is an exploitable trade-off between the unemployment rate and the inflation rate i.e. unemployment can be reduced at the expense of higher inflation.

The Phillips Curve was first established in 1958 by an economist named A. W. Phillips, in which 96 years worth of data was collected on wage inflation and unemployment. The data points were plotted on a graph, with the unemployment rate on the x axis and the wage inflation rate on the y axis. A line of best fit was then drawn through this collection of data points and this line of best fit was downward sloping, showing the inverse relationship between the two variables and this has now become known as the Phillips Curve.

Since then the Phillips Curve has been adapted to provide more theoretical importance for policymakers to consider when setting economic policies. As now the inflation rate (price inflation) is used instead of wage inflation. The result of the inverse relationship still holds but now concerns the inflation rate instead. 

Below is a diagram to illustrate the basic convex shape of the conventional Phillips curve discovered by A. W. Phillips. This curve illustrates the main policy trade-off facing governments i.e. a government cannot achieve both low unemployment and inflation. 


By using this curve the government can aim to reduce the unemployment rate by introducing an aggregate demand stimulus, which increases real output and unemployment in the process, but at the same time this creates inflationary pressures (demand pull inflation) as a result of a positive output gap emerging. This positive AD shift can be represented by a movement up the Phillips curve to signify an increasing inflation rate when the unemployment rate decreases.


However, in the 1970's the smooth, stable inverse relationship seen in the Phillips curve between the inflation rate and the unemployment rate began to break down as suddenly data points were being recorded where both the unemployment and inflation rate were high and this contradicted the main result of the original Phillips curve. 

As a result of this, it was commonly accepted that in the long-run the Phillips curve would take a different form and the trade-off between inflation and unemployment would disappear. The long run Phillips curve is vertical at the natural rate of unemployment and depicts no exploitable trade-off between the inflation rate and the unemployment rate. The key difference for policymakers when dealing with the LRPC is that demand side policies designed to reduce the unemployment rate below the natural rate do not prove effective as workers re-adjust their wage aspirations in light of higher inflation, which means unemployment  always remains at the same level in the long-run but with higher inflationary pressures. So effectively the long run Phillips curve is established by multiple shifts of the short run Phillips curve

The distinction between the shape of the short run and long run Phillips curve is shown below.


Therefore, in the long-run the only way to reduce the natural rate of unemployment is to introduce specific supply side policies which aim to improve the productive capacity of the economy by creating sustainable unemployment reductions, which create an LRAS shift (outwards) in the process. Persistent demand side policies will create an inflationary outcome for the economy. However, these policies must be specifically targeted to improve worker flexibility otherwise will not create the curve movements required to reduce unemployment below the natural rate.

The Phillips curve is a contentious issue as it all depends on your political persuasion, in terms of how the curve is interpreted. But, the main evaluation points regarding the Phillips curve are:

  • Recent evidence from the UK economy appears to contradict the main theoretical result of the Phillips Curve i.e. data points reflecting high unemployment and inflation rate.
  • The current version of the Phillips Curve is an adapted version of the original i.e. shows price inflation instead of wage inflation.
  • The Phillips Curve may be subject to measurement errors/biases because data quality and changing nature of data will affect the outcome depicted by the Phillips curve.
  • The distinction between the short run and long run Phillips Curve i.e the trade-off is not present in the long-run.
  • To take into account the type of expectations that economic agents have i.e. if economic agents have rational expectations it might mean there is no short-run and long-run distinction between the Phillips Curve. 

Planned supply

The level of output that firms plan to supply. This can be problematic as decisions have to be taken before actual demand conditions are known. This is particularly problematic in agriculture when supply decisions have to be made many months in advance.

Policy compromise

When a government policy is weakened to allow achievement of another objective e.g. when greater cuts are experienced across other government departments to preserve expenditure in priority areas.

Policy conflict

When a policy works against the achievement of another objective e.g. building additional transportation links is unlikely to contribute to the achievement of environmental objectives.

Policy indicator

A measure selected by government to determine the achievement of policy objectives e.g. any reduction in the percentage of students achieving C grade or better in A2 examinations is an indicator of the impact of education cuts.

Policy instrument

An initiative implemented to help achieve a policy objective e.g. regulations to prevent smoking in public places.

Policy objective

This is the purpose or what the policy is attempting to achieve e.g. the austerity policy was attempting to protect the economy in the long term by avoiding increased borrowing costs for government, firms and individuals.

Pollution permits

Issued by the government to authorise producers to produce a specified amount of pollution. Provided the system can be policed effectively it can correct market failure by limiting pollution and the output associated with it.

It is important for the government to control pollution as pollution is an example of a negative production externality which gets released onto society and as a result exposes society to a large social cost. Pollution is produced as a result of manufacturers failing to recognise the wider cost to society of this pollution being created during the production of goods and services. Therefore to protect social welfare and to remove the dead weight loss triangle associated with these goods, governments are committed to meeting pollution reduction targets. They hope that by placing these pollution targets on society it will incentivise private businesses to adapt their production process, in order to reduce pollution levels.

Pollution permits are issued and released into the market via the government and the key characteristic surrounding these permits, is that the fact that they are tradable  i.e. pollution permits can be bought and sold between firms. The permits themselves grant an individual firm the legal right to produce a fixed level of pollution. The permits are enforced via financial punishments to ensure that firms stick to the pollution permit limits. But crucially, any firm that produces below their emissions limit can then sell the rest of the permitted emission allocation to other firms who have exceeded their pollution limit. This works because their are some firms that make use of materials throughout the production process that produce vast amounts of pollution and to keep the business going they must continue to pollute.  This effectively means the firms that pollute the most, must acquire the greatest amount of pollution permits. Therefore, it is these firms that have to face the greatest burden of the permits, as they increase the firms costs, reducing their profitability and making them less competitive.

The desired outcome of the policy is that after a period of time firms will have transformed their production process into a more emission friendly process (via green technology) so that they can reduce the amount of pollution permits they are required to buy and hold. Eventually, if all firms can successfully implement a more environmentally friendly approach to their production process, then the government can gradually decrease the number of permits circulating in the market.

In 1997, an agreement called the Kyoto Treaty was signed to enforce tradable pollution permits across countries. In this instance, each country was awarded a pollution permit to limit their carbon dioxide emissions. The countries which were able to reduce their emissions cheaply were incentivised to do so. This meant they could sell the rest of their quota off to countries which required more pollution permits.

It is also important to consider the limits of the pollution permits effectiveness in reducing the overall level of pollution. These will be good evaluation points to make in an exam.

Firstly, it is very difficult for the government to identify the optimal quantity of permits to issue in the market and the most appropriate way to distribute them in the first place. Introducing too many permits into the market will lead to pollution levels staying at the same level. Not issuing enough permits will have the opposite effect and firms will become unnecessarily constrained and this can reduce the activity, efficiency and productivity of these firms.

Also, as pollution is a negative externality it makes it very difficult to measure and quantify and therefore this makes it difficult for the government to set the right pollution limit per permit. 

Pollution permits are also criticised because they do not actually address the issue of pollution and instead create a system in which the least polluting firms receive the smallest amount of permits, whilst the most polluting firms receive a large percentage of the permits. Therefore, they can fail to make a substantial impact on the pollution levels of firms and a country. Alternative policies such as indirect taxation may prove more effective in curbing pollution levels in a country as this allows the externality to be internalised. These alternative policies might also be easier to implement, as it does not require significant monitoring like in the case of permits. The administration costs may well be lower as well.  


Portfolio Investment

An investment to acquire shares of a company that does not establish any control over the management of a company. For the purpose of national trade accounts investments must not acquire more than 10% of a company to be categorised as portfolio investment.

Portfolios

The financial assets owned by individuals or firms.

Positive consumption externalities

Benefits arising from the consumption of a good or service that are experienced by third parties e.g. the benefits of education apply to society as much as to the recipient.

These goods are often under-provided and are called a merit good. This is because there is a divergence between the marginal private benefit and the marginal social benefit which causes individual producers to under provide the good, as the producers do not take into account the long-run benefits that this good creates for society. As a result this creates a dead weight loss triangle and market failure. 


Positive expectations

When the future outlook for economic variables is positive e.g. interest rates will fall and the economy will grow at a faster rate.

Positive externalities

Are positive costs and benefits arising from the process of production and consumption that are incurred or experienced by third parties.

Positive externality

Are positive costs and benefits arising from the process of production and consumption that are incurred or experienced by third parties.

Positive output gap

When actual GDP is greater than the value of GDP if it had grown consistently in line with the trend rate of GDP growth. Normally characterised by rising real output and inflation.


Positive production externalities

Benefits arising from the production of a good or service that are experienced by third parties e.g. the benefits of innovation spillover especially after the expiry of patents.

Below is a diagram to show a positive production externality that is being imposed on third parties. This caused because of the divergence between the marginal private cost and marginal social cost. Because individual producers do not realise the positive externality they are releasing onto society they produce a level of output below the socially optimal level, creating a dead weight loss triangle and market failure.


Positive statement

Is a statement on an economic issue that is supported by factual evidence.

Potential Competition

This is the level of competition that could develop in a contestable market if firms decide to engage in hit-and-run entry.


Poverty or earnings trap

When individuals in work do not perceive any benefit in a wage rise as the increase in taxes and loss of welfare benefits this triggers may mean that they are no better off.

PPF

A convex curve that joins all possible combinations of output when all resources are fully engaged in production.

The diagram below shows the basic shape of a country's PPF, illustrating the the distribution and allocation of resources towards producing goods to help the economy achieve the full employment level of output. Any point on the PPF is a point that is pareto optimal, productively and allocatively efficient due to the utilisation of all the factors of prodcution in the economy.


Predatory Pricing

Is when a firm decides to set a price below the marginal cost curve for a short period of time to induce the exit of a financially inferior rival out of the market. The incumbent firm engaging in this behaviour makes a short-term loss but as long as this can be recouperated with higher supernormal profits immediately after the rival's exit the firm will be willing to engage in this strategy.

Below is a graphic to show the logical chain of reasoning behind the process of a predator pricing strategy by an incumbent firm.


Premises

The physical location used by a productive process e.g. office, factory or shop.

Premiuim to par

Is a term to describe a bond that is being sold and traded above its par value and hence at a premium. This can happen for a variety of reasons but the most common reason is when interest rates being to fall. A bond will then trade at a premium as it will offer a higher coupon rate compared to the interest earned on similar risk-related assets i.e. the excess demand for bonds will force the bond to trade at a premium, but investors will be happy to purchase this as they want a bond that offers them a higher yield over similar risk assets.


Preventive Regulation

Aims to curb excessive risk-taking, and has tended to focus on capital adequacy requirements with assets such as BASLE and ensure that banks are kept on a going concern basis.


Price

The financial value that consumers place on the utility they derive from consuming a good or service.


Price Bubble

When prices rise rapidly over a period of time (weeks or months) and then drop within a very short period (days). These cycles are often initiated by a supply side shock and perpetuated by subsequent speculation encouraged by the opportunity to profit from rising prices.

Price control

These are imposed by governments to control prices in specific markets. The control will be structured to reduce price fluctuations or prevent very high/low prices.

Price controls

These are imposed by Governments to control the price in specific markets. The control will be structured to reduce price fluctuations or prevent very high/low prices.

These restrictions governing the price a market can sell a product for, is done in order to improve on the outcome achieved by the free market.

The two forms of price controls are:

  • Maximum Price
  • Minimum Price

The important point to understand when evaluating the effectiveness of price controls is the position of the price relative to the equilibrium price. For a maximum price to be binding, the max. price needs to be set below the market equilibrium price to force pressure on firms for the existing price to fall. Likewise, for a minimum price to be binding, the min. price needs to be set above the market equilibrium price to force pressure for the existing price to rise. Below is a set of diagrams to show this:

Because these price controls are distorting the market equilibrium that would prevail under the free market, it does introduce welfare implication for society. Under a max. price, producer surplus decreases (as firms are selling less goods at a lower price) and consumer surplus has a net increase (as the fall in consumption is overridden by the benefit of falling prices). However, there is a dead weight loss triangle that is created from this price because of that fact there is a loss of potential beneficial exchanges which could of been made at the market equilibrium i.e. producers were willing to sell at a higher price and consumers willing to purchase at a higher price. Therefore, social welfare is likely to be reduced. 

Likewise, for a min. price, producer surplus has a net increase (as firms are selling goods at a higher price despite the fall in consumption) and consumer surplus has a decreases (as consumption falls as well as prices rising). However, there is a dead weight loss triangle that is created from this price because of that fact there is a loss of potential beneficial exchanges which could of been made at the market equilibrium i.e. producers were willing to sell at a lower price and consumers willing to purchase at a lower price. Therefore, social welfare is likely to be reduced.

The welfare implications of the price controls is shown below in a demand and supply framework.

 Therefore it is the presence of the disequilibrium in the market which creates the dead weight loss triangle.

In terms of policy solutions, the government could introduce a subsidy in order to maintain the maximum price. This will outwardly shift the supply curve and remove the dead weight loss triangle and increase social welfare. However, this is expensive from the government's perspective as the subsidy may need to be financed by higher taxes or diverted expenditure from other areas of the economy. This also involves an opportunity cost, as alternative projects have had to be sacrificed as a result.

To eliminate the excess supply in the presence of a minimum price, the government could buy up the surplus of stock that firms have, in order to prevent them from dumping them on the market for a lower price. By doing so would shift the demand curve outwards and remove the dead weight loss triangle. This policy is similar to what is seen in a buffer stock scheme in agricultural markets. The main issue with this policy is that the government will be left with a surplus of stock of the good, this is problematic because storing inventories of a good can be very expensive from the government's perspective, but at the same time destroying this stock of goods is seen as a waste of resources. 

Below is set of diagrams to show the desired outcome of these policies (move to point c):


Price deflation

The rate of inflation is less than 0%.

Price Discrimination

The action of selling the same product to different groups of people (or in different circumstances) for different prices. This is done so that firms can convert as much consumer surplus into revenue and profits. 

There are three different forms of price discrimination that firms can choose from:

  1. First Degree Price Discrimination - charging consumers the maximum price they are willing to pay for 
  2. Second Degree Price Discrimination - charging consumers different prices based on the quantities consumed
  3. Third Degree Price Discrimination - charging consumers different prices based on the type of market segment they are in

However, producers only have the ability to set these forms of price discrimination if certain conditions in the market hold:

  1. The firms involved must be price makers to ensure that they can set the appropriate price that fits into their pricing strategies. Therefore, price discrimination is a strategy that can only be used if the market is imperfectly competitive. The more market power an individual firm has, the more successful price discrimination is likely to be for the firm. In a perfectly competitive market, price discrimination cannot take place because all firms have to take the current prevailing price as given. 
  2. The firm involved must be able to segregate the market into different types of consumers. Price discrimination is unsuccessful in markets that cannot be segregated because it allows the resale of the product from one consumer to another. This means that consumers who can purchase the product at a low price and then go on to sell their product onto a consumer that was facing a higher price. This is not the case for train tickets as children are charged a lower price than adults and cannot sell this ticket onto adults because of the fact that the markets has been divided into two sub-markets. Firms can segregate the market by dividing consumers up into different types based on: the time of consumption, gender, age, income status, location and consumption preferences.
  3. The consumers that are sold a product must have different price elasticities of demand, so that the firm can charge the consumers that are willing to pay a higher price a higher price, but for consumers who are not willing to pay a high price will be charged a lower price, so that encourages more consumers to consume. Therefore the elasticity of demand for consumers signals to firms how reluctant certain consumers are for paying a high price i.e. inelastic demand signals to the firm a high price and elastic demand signals to firms a low price.

The most common example of price discrimination is third degree price discrimination in which firms identify different types of consumers and a separate price is charged to each of the type of consumers e.g. train, cinema and theme park tickets.

Price discrimination diagrams can often be quite complicated to draw so the best way to draw these types of diagrams to remember a step by step procedure in which a new element on the diagrams is placed on at each step to make sure all elements of the price discrimination diagrams have been drawn. Below we are going to show the step by step process that needs to be taken  to highlight the impact of third degree price discrimination on the different sub-markets as well as the firm. For this particular case we are assuming that the firm involved is a monopolist and the conditions that are required for price discrimination are satisfied and the monopolist has segregated the market into two sub-markets - A and B. 

For the step by step process, the new elements added in at each stage will be highlighted in red and the stage achieved at the previous stage will be highlighted in black. 

This step involves setting up the diagrams. As this is a micro diagram for a a specific diagram the x axis represents quantity and the y axis represents price.

This step concerns drawing the two separate demand curves for market segment A and B. The monopolist splits the market into two sub-markets based on the fact that the consumers in the two sub-markets have a different elasticity of demand. Sub-market A faces an inelastic demand curve and sub-market B faces and elastic demand curve.

At any price above P, there are no sales to market B, so therefore at P and above the monopolist demand curve follows the same shape as the demand curve for market A.

At prices below P, sales are made to both sub-markets (B represents the demand corresponding to Market A and C represents the demand corresponding to Market B). Therefore, the part of the demand curve for the monopolist below the price of P is formed by adding horizontally the two sub-market demand curves together below this price.

The Marginal Revenue curve is always twice as steep as the Average Revenue curve.

The MR curve for the monopolist is formed by combing the marginal revenue curves from both sub-markets, using the same logic of how the AR curves were formed. The MR curve for the monopolist is twice as steep as the relevant sections of the AR curve.


Marginal Cost curve for the monopolist takes the usual tick-shaped form.

Monopolist profit maximises at the usual profit-maximising condition of MR=MC, but as a result of the market power it holds it can set a price up to the AR curve.

As the monopolist applies price discrimination to the two sub-markets the price of P is not set across the sub-markets. Instead they maximise profits by selling a higher quantity to market B and sell less to market A. To profit maximise across markets the condition that needs to be satisfied is that the MRA=MRB=MR across all markets. To achieve this the sub-markets needs to be charged different prices. Market A which has an inelastic demand curve, a higher price is charged because consumers are willing to buy the product at a higher price. However, market B has an elastic demand curve so a lower price to maximise the amount of revenue the monopolist can exploit from these reluctant consumers.

To identify the profits made by the monopolist via price discrimination the average cost curve needs to be drawn on for the monopolist.

Supernormal profits represent difference between sales revenue and costs of production. This method of price discrimination brings the monopolist larger profits at the expense of consumer surplus. 

Through the fact that the market becomes segmented, the pricing strategy increases total revenue when compared under a fixed pricing strategy and this increases the level of profit accruing to the monopolist as a result of an increase in sales. Also because of that fact that the firm has increased their scale of production it means it is likely to see a reduction in the firms costs as a result of a movement down the average cost curve, which can further increase profits in the long-run. However, whether the increased profits lead to better quality products and lower prices for consumers depends on the type of firm involved and whether they have the incentive to invest in R&D projects which can feed through to dynamic efficiency benefits. This may all depend on the type of industry at hand.

An evaluation point that could be mentioned when talking about price discrimination is the impact on consumers. This is because there are two types of consumers in the market and some will experience higher prices whilst others will experience lower prices and therefore the overall impact seen on consumers will all depend on the experience that consumers have in the market.


Price disinflation

When the rate of inflation reduces e.g. CPI grew by 2.2% in the year to October 2013 but reduced to 2.1% in the year to November 2013.

Price elasticity of demand

The proportionate change of the quantity demanded of a good in response to a proportionate change in price.

A good is classified as inelastic if it has a PED value that it less than 1.

A good is classified as elastic if it has a PED value that is greater than 1.

A good is classified as unit elastic if it has a PED value that is equal to 1.

The value of the PED for a good determines the type (slope and position) of demand curve in the market.


Price elasticity of supply

The proportionate change of the quantity supplied of a good in response to a proportionate change in price.

A good is classified as inelastic if it has a PES value that it less than 1.

A good is classified as elastic if it has a PES value that is greater than 1.

A good is classified as unit elastic if it has a PES value that is equal to 1.

The value of the PES for a good determines the type (slope and position) of supply curve in the market.


Price inflation

When the prices of goods and services rise over a period of time. The rate of inflation is positive.

Price level

The average price of goods and services in an economy. This is normally determined by measuring the price changes relating to a representative sample of goods and services

Price Maker

A firm that has a very strong market position and is able to dictate the price that consumers pay for its goods and services. This is normally associated with a firm that possesses monopoly power.

Below is a diagram to show how monopolistic firms can restrict output and charge whatever price they wish to do so to maximise profits. This is not the case in perfectly competitive markets where all firms have to take the market price as given and are price takers as they are all competing over a homogeneous good.


Price mechanism

How the interaction of demand and supply determine the price and quantities of the goods that get produced.

This price mechanism has three individual functions that it performs:

  • The first is the rationing function which enables prices to change in order to curb or encourage demand in order to cope with limited or excess supply. This often happens for the demand for sporting event tickets.
  • Then there is the signalling function which means that prices are there to inform economic agents about market fluctuations i.e. if the price of a good is high this signals to producers that this good is in high demand and therefore they should produce more.
  • Finally, prices have an incentive function which provides agents with the incentives to change their behaviour i.e. firms are incentivised to produce more goods if the price is high due to higher margins and profit incentives.

Below is a brief summary of these functions of the price mechanism.


Price Taker

When firms in a market do not have sufficient market power to be able to influence the market price and as a result charge the optimal price in order to maximise profits. All firms in a perfectly competitive market are classified as price takers due to size of the market and close substitutes available to each firm's product.

Below is a diagram to illustrate price takers in a perfectly competitive market. These firms have to accept the market price as given due to the fact that they are in a market with hundreds of firms all producing a homogeneous product and therefore no firm has sufficient market power or control to set their own prices.


Price War

Occur where firms compete with each other to charge lower prices and thereby force the market price down. This has occured most recently in the UK Supermarket Industry with discount stores such as Aldi and Lidl relentlessly slashing prices of popular products below that of the Big 4 supermarkets.

Below is the logical chain of reasoning to emphasise the main features of a price war.


Primary Products

Raw materials that are either extracted or farmed from land and the sea.

Principal

The individual that authorises an agent to act on their behalf in personal and business transactions.


Principal agent problem

Scenarios in which economic outcomes are distorted because economic agents (principal) rely on the services of and are influenced by an agent that may have different objectives/incentives.

The most common example of this is the differing objectives between shareholders and managers. Shareholders wish to maximise profits and managers have internal goals relating to self-interest, but due to asymmetrical information it is difficult for shareholders to detect this.

Below is a breakdown of this type of problem relating to shareholders and managers. In this case the manager has three main objectives to achieve alongside maximising return for shareholders. For instance it may be that managers try to help the firm acquire as much market share as possible in order to make the firm grow and expand to meet those customers. This is becaue firms that have exponentially grown are often the firms that are most impressive from a manager's performance persepctive and therefore it will put the manager's value higher from not just within the company but from external companies. Therefore they may decide to reinvest majority of the profits the company makes to help fuel expansion rather than paying higher dividends to shareholders.


Prisoners' Dilemma

A situation analysed using game theory that shows why two rational individuals might not cooperate, despite it being in their best interests to do so.The Nash Equilibrium in this game will always be for both players to betray each other despite the payoffs for both players being higher if they were willing to cooperate. This game is based on the idea of two prisoners who have committed a crime with an adverse feeling towards years in prison.

Below is a payoff matrix to illustrate the equilibrium concept of the game.


Private costs and benefits

The costs or benefits experienced by buyers and sellers that are reflected in the market equilibrium position.

Private Debt

Private sector debt is the stock of liabilities held by the sectors non-financial corporations. This is comprised of personal loans, personal mortgages, business debts, and debts of the financial sector.


Private Equity Company

Is an investment company that makes investments in the equity of companies with funding raised by retail and institutional investors.


Private good

A good that is scarce because it is excludable (it is possible to exclude non-consumers from the benefit of a good or service) and rivalrous (the consumption of a good by one consumer diminishes the amount of the good available to other consumers).

Private goods

A good that is scarce because it is excludable (it is possible to exclude non-consumers from the benefit of a good or service) and rivalrous (the consumption of a good by one consumer diminishes the amount of the good available to other consumers).

Privately optimal output

The equilibrium level of output if external costs/benefits experienced by third parties are not reflected in the market equilibrium.

Privatisation

The process by which a state owned enterprise would be sold to private and institutional investors e.g. Royal Mail.

Producer Sovereignty

The production of goods and services is influenced by the preferences of producers.


Producer surplus

The benefit achieved by suppliers because the equilibrium price is higher than the price suppliers would be prepared to supply the goods at. This is always represented by the area above the supply curve and below the market price.


Producer tax burden

The amount by which the imposition of an indirect tax will reduce producer surplus. The tax burden imposed on producers will depend crucially on the elasticity of the demand curve facing the market. As the less price sensitive consumers are the more of the tax that can be passed onto them in the form of higher prices as it will increase their level of profit despite price rises due to a lack of drop-off in demand.

Below is a diagram to illustrate how the imposition of an indirect tax implaces a burden on producers. In this instance the demand curve is neither inelastic or elastic and therefore the tax burden is split evenly between the consumers and producers.

Below is a diagram to illustrate when the demand curve is inelastic and therefore the tax burden is split unevenly towards consumers ahead of producers.

Below is a diagram to illustrate when the demand curve is elastic and therefore the tax burden on producers is small.


Product differentiation

The process by which the features of products are varied and promoted to differentiate a product from other similar products.

Production

The process that converts factors of production into goods and services.


Production externality

Externalities that arise from the production of a good.

Production possibility diagram

A diagram that plots all the possible combinations of goods and services that an economy could produce.

The diagram below shows the basic shape of a country's PPF, illustrating the the distribution and allocation of resources towards producing goods to help the economy achieve the full employment level of output. Any point on the PPF is a point that is pareto optimal, productively and allocatively efficient due to the utilisation of all the factors of prodcution in the economy.


Production possibility frontier

A convex curve that graphically represents the production points for an economy where all resources are fully engaged in the production of an economy's goods and services.

The PPF is the diagram that is best used to highlight the economic problem because if an economy moves from one point on the PPF to another it involves an opportunity cost as finite and scarce resources have to be diverted from one industry to another. This increases the production of one good but decreases the production of the other. The decrease in production represents the opportunity cost and this is quantified by the gradient of the PPF at any one point.

The diagram below shows the basic shape of a country's PPF, illustrating the distribution and allocation of resources towards producing goods to help the economy achieve the full employment level of output. Any point on the PPF is a point that is Pareto optimal, productively and allocatively efficient due to the utilisation of all the factors of prodcution in the economy (Point B, C, and D). However, if the economy is producing at a point inside the PPF (Point A) this represents a feasible production point, but one that is productively inefficient. This is because at this point an economy can increase the production of one good without a resultant fall in the production of another good, due to the fact that there are unemployed resources at this production point.

An economy can produce at any point on or inside the PPF. However, if the economy tries to produce at a point beyond its existing PPF (Point E), this is an infeasible production point assuming ceteris paribus. This is because even if an economy utilises all of the economic resources available any point beyond the PPF is unattainable unless an economy experiences an increase in the quality and/or quantity of factors of production available. 


Productive Efficiency

When output occurs at a point where average costs are lowest (the lowest point on the average cost curve) and all resources are fully utilised in production (actual production will position output at a point on the PPF).

Below is a diagram to show how individual firms and an economy achieve productive efficiency. For individual firms, they are charging a price at the lowest point of the average cost curve which means they are producing goods at their most productive point. For the economy to be productively efficient all firms have to be using all factors of production in the most efficient way and hence lie on the frontier of the PPF.

Productive efficiency graph


Productive inefficiency

When output occurs at a cost higher than minimum average cost (any point other than the lowest point on the average cost curve) and at a point where some resources are not utilised (and point within and not on the PPF)

Below are a set of diagrams to illustrate when individual firms and the economy are producing at a productively inefficient point and therefore costs are not being minimised.


Productive potential

The amount of goods and services that an economy is capable of producing.

Productivity

A measure of production representing the output produced by each input. It is usually measured by units of input.

Below is a graphic to assess that out of the following firms, Firm B is more productive than Firm A because it uses the same number of inputs but produces 10 times more units of output.


Profit

The reward for Enterprise. It is the difference between sales revenue and costs. There are many different definitions and it is important to understand the difference between normal profit and abnormal profit.

Progressive tax

Are usually direct taxes on assessable income and wealth. The tax will be structured so that a higher proportion of the assessable item is paid in tax as the assessable amount rises e.g. income tax.

Progressive taxes

Are usually direct taxes on assessable income and wealth. The tax will be structured so that a higher proportion of the assessable item is paid in tax as the assessable amount rises e.g. income tax.

Propensity to consume

How much of their income consumers are prepared to spend.

Propensity to save

How much of their income consumers are prepared to save.

Property deeds

A legal document confirming ownership and the terms of ownership of a property.

Property rights

When consumers buy a good or service they usually acquire property rights which means that they have exclusive rights to use or benefit from consumption of the good. However, there are situations where external benefits may dilute these property rights.

Proportionate change

When a change in one variable is accompanied by a change in another variable and this proportionate change remains the same regardless of the values. 


Proportionate tax

A simpler alternative to direct and progressive taxes which apply the same single rate of tax on all the income and wealth of all taxpayers.

Protective Regulation

Is a type of regulation that focuses on ensuring that economic agents such as depositors and taxpayers are protected from unnecessary risk taking in the financial sector. This type of regulation often takes the form of lender of the last resort facilities and deposit protection (which can in turn lead to more moral hazard problems though).


Prudential Regulation Authority (PRA)

Resposnsible for the supervision of individual financial institutions, to ensure the individual risks are managed appropriately. Ensuring failure does not lead to contagion effects elsewhere in the financial sector. Therefore they mainly specialise in macro prudential regulation.

Below is an illustration of the UK regulatory structure of the financial sector.


Public Debt

Is the debt that is owned by the government of a country. A high level of public sector debt can be argued to be positive and negtaive for the economy depending on the person's inclined way of thinking. It can increase economic growh by fostering more investment in infrastructure or it can decreae economic growth via crowding-out effects.

Below is a graphic to show that if the government runs up a significant budget deficit then it accumlates the level of public national debt for a country. This is why government's are under pressure to not consistently run a budget deficit, so that the burden of debt can be be shaved off. As the more indebted a country becomes the lower their creditworthiness is i.e. credit rating deterioriates.


Public expenditure

The expenditure undertaken by the government to provide things like welfare benefits, public services and infrastructure.

Below is a breakdown of the main sectors that public expenditure has been allocated to by the government in 2014/15. With current spending attracting the biggest percentage of this expenditure as this represents the ongoing costs of maintaining government services.


Public goods

A good that is non-excludable (it is not possible to exclude non-consumers from the benefit of a good or service i.e free rider problem) and non-rival (the consumption of a good by one consumer does not diminish the supply available to other consumers) e.g. armed forces, police, street lighting, flood defences


Public Sector Net Borrowing Requirement (PSNBR)

This is the difference between government spending plans and the amount of taxation revenue it raises. As it includes any proceeds from the sale of government assets it represents the amount of money a government needs to borrow to make sure all expenditure is funded.


Public Sector Net Cash Requirement (PSNCR)

This is the difference between government spending plans and the amount of taxation revenue it raises excluding any proceeds from the sale of government assets

Purchasing power parity

A concept that helps to compare the difference in the cost of the same good or service in different countries by using exchange rates to convert the price of the good into a single currency. Parity exists if there is no differential.

Pure monopoly

A market that is un-competitive as it consists of just a single firm. Very few remaining examples in the UK due to the break up and privatisation of the post war state monopolies.

Pure public goods

A good that is non-excludable (it is not possible to exclude non-consumers from the benefit of a good or service i.e free rider problem) and non-rival (the consumption of a good by one consumer does not diminish the supply available to other consumers) e.g. armed forces, police, street lighting, flood defences


Quantitative Easing

The process by which central banks create new money to buy sovereign debt and other financial assets. This aims to stimulate economic growth by increasing credit available to individuals and firms, reducing the cost of new and existing borrowing and produce various wealth effects by increasing the value of financial assets.

Below highlights the theoretical impact of QE into an economy with deficient aggregate demand. The purchasing of bonds makes credit cheaper and easier for business, individuals and households to acquire and therefore increases the amount of economic activity through business expansions and and house purchases. Ultimately, this contributes to a higher level of aggregate demand and despite introducing some inflationary pressures this is just moving the economy back to the full employment level. 


Quantitative Tightening

A policy that might occur after a period of quantitative easing if there are signs the economy is over-heating. It would involve the central bank selling the financial assets it acquired via quantitive easing to increase supply and reduce the value of these assets. It should help to slow economic growth and help control rising inflation as it will reduce availability of credit, increase borrowing costs and reduce the value of assets.

Below is a diagram to show how this policy works. In this instance, the central bank has already engaged in some form of QE and this has removed the negative output gap for the economy but has now created a positive output gap, putting the economy on an inflation alert. Therefore this policy aims to move the economy back to the full employment level of output to keep inflation in check and in line with the CPI inflation target. This is highlighted by a small inward shift of the aggregate demand curve to AD2. Restoring the economy to it's capacity.


Quantity demanded

The amount of a good or service consumers will buy at any given price.

Below is an illustration of a typical downward sloping demand curve. This shows that when the market price for a particular good begins to fall this causes the quantity demanded for that good to rise. This is often known as the Law of Demand and why demand curves for conventional goods always have a negative slope.


Quantity supplied

The amount of a good or service firms plan to supply to the market at a given price.

Below is an illustration of a typical upward sloping supply curve. This shows that when the market price for a particular good begins to rise this causes the quantity supplied for that good to rise. This is because firms have a profit incentive to sell more goods at higher prices. But also if they are to produce more goods, production costs rise in line with that and therefore they have to charge a higher price to maintain margins.


Quasi public goods

Goods that have the feel of public goods but do not completely satisfy the definition of a public good. They are largely non-rival (apart from during peak/times and periods) and it is possible to exclude third parties from the benefits but the costs associated with this mean that this is rarely enforced. e.g. roads and NHS.

Quick Ratio

Refines the Current Ratio by measuing the amount of the most liquid current assets there are to cover current liabilities. This helps avoid the problem of the Current Ratio as it only includes the most liqiuid assets. Generally speaking the higher is the ratio the safer the bank is perceived to be.


Rate of inflation

This is the rate at which the general level of prices rise over a period of time. e.g. CPI or RPI.

Rate of return regulation

This policy might be used to regulate pricing abuses in monopoly situations. It effectively restricts the rate of return that can be earned on the capital employed in a business.

Rational Expectations

When people form their inflation expectations by using all the available information at their disposal.

Below is an illustration of rational expectations in a supply and demand framework and its effects on the economy. As individuals are using all of the information at their disposal to form their inflation expectations if they see an expansion in the aggregate demand curve creating inflationary pressures, automatically they will negotiate higher wage demands so that real wages are unaffected and therefore the shift of the AD and SRAS curve happen automatically and if agents have these forms of expectations then it is just a continual movement up the LRAS curve from a to c.

In terms of the phillips curve it just shifts up the short-run phillips curve at the natural rate of unemployment creating a new long-run phillips curve as shown below.


Rationing function of prices

This is also known as the allocating function of prices. As the price mechanism determines what consumers spend their money on it also determines how scarce resources are allocated (used).

Real GDP

Is a macroeconomic measure of the value of economic output adjusted for price changes.

This measure deflates the nominal measure of GDP as nominal GDP can change because of price changes and output changes. Therefore this measure just takes away all the price changes from the nominal GDP measure and therefore makes the real measure of GDP a measure of productivity changes.


Real incomes

The value of incomes received after allowing for inflation.

Real interest rate

This is the rate of interest adjusted for the rate of inflation e.g. if the rate of interest on a savings account is 0.5% and inflation is 2.0% the real interest rate is - 1.5%.

Real value

This is the value of a variable after allowing for inflation.


Real wage unemployment

Unemployment that occurs when labour market imperfections preserve a higher real wage rate than the equilibrium real wage rate.

Below is a diagram to show the labour market in disequilibrium and how this type of unemployment persists. In this instance, the wage rate has been pushed up to W1 and this has caused the supply of labour to rise as workers have a greater incentive to supply more hours of labour, as the reward per hour of work is greater. However, the demand for labour falls as firms have less incentive to employ workers at a higher wage rate and therefore the divergence between the supply and demand for labour creates this form of unemployment. This type of unemployment is normally created due to the imposition or increase of a national minimum wage rate which is fixed above the prevailing wage rate.


Recession

Negative real GDP growth for 2 consecutive quarters.

Below is a diagram that shows the level of real GDP growth for the UK economy in terms of quarters. As can be seen from the graph the red shaded regions represent when the economy has gone through a period of two consecutive periods of negative growth and therefore this being officially classified as a recession or a downturn. These periods correspond to the 2008 global financial crisis and the early 1990's recession.


Reciprocal Absolute Advantage

In a two good, two country situation each country benefits from an absolute advantage (i.e. more efficient production as they can make more goods with the same resources) in one of the two goods. This provides each country an incentive to specialise in the good exhibiting an abosolute advantage and to acquire the good it would otherwise produce inefficiently by trading with the other country. 

In the following example we have two countries and both produce two goods. The country that can produce the most units of each good given the same resources has the absolute advantage in the production of that good. As the absolute advantage is reciprocal there is a clear incentive to specialise and trade. In this example Australia has an advantage in lamb and China has advantage in cloth.

In this sutatiuon the the PPF for each country would intersect (see below).


Rectangular hyperbola

A curve formed by co-ordinates that when multiplied produce the same value. In micro economics the p/q combinations taken from a demand curve formed by co-ordinates exhibiting these properties will always produce the same amount of revenue and exhibit PED of -1 (unitary elasticity). As revenue is constant at all points on the curve it is not possible to achieve a higher amount of revenue by changing price or output.

Below is an example of this type of curve to represent the typical downward sloping demand curve. In this instance the same law of demand applies but it's just that the relationship between price and quantity demanded is unit elastic at all levels.


Reflation

An increase in real output in response to fiscal and monetary policy.

Regressive taxes

Are usually indirect taxes and although all tax payers pay the same tax on identical transactions the tax as a proportion of income will be higher at lower levels of income e.g. petrol duty.

Regulation

Rules and laws enforced by governments that influence the supply and consumption of specific goods and services e.g motor insurance is compulsory, annual MOT test enforces a minimum safety standard on motor vehicles, no smoking in places of employment.

Regulation is predominantly used to control externalities present in a market. That is because the presence of these externalities leads to social welfare being lower than what could be achieved, due to the presence of a dead weight loss triangle e.g. a negative production externality. Therefore, regulation allows governments to remedy perceived flaws in the economic system by helping combat the private incentives of firms.

Externalities can be reduced through a number of different policy approaches but regulation reduces/removes an externality differently compared to indirect taxation and subsidies. This is because regulation does not affect the marginal private cost curve's position relative to the marginal social cost curve (like an indirect tax or subsidy would do). Instead it places a fixed limit on the output of the good in the market. This means that  if the regulations are respected by operating firms in the market, then the market output will not exceed that point. Therefore, it is the government's role to identify where the point at which social welfare is maximised (social optimum) and then set the degree and level of regulation based on that point. If they can correctly identify this point the regulation will ensure the social optimum is met, welfare is maximised and the market failure no longer persists. 

The desired outcome of regulation in a market where a negative production externality is produced is shown below.

As a result of a negative production externality being produced, output needs to be reduced via regulation. The output limit is set at Qsoc to maximise social welfare.

However, the ability of the government to be able to identify this social optimum point (B) in reality is much more complex and challenging. Therefore, the government has to estimate this point and this can lead to the wrong level of regulation being imposed on the market. They may place too much regulation on the market worsening the outcome prior to intervention and move the market from one extreme to another i.e. the good goes from being over-provided to under-provided. In this case the red tape from the regulation has become excessive and places unnecessary restrictions on firms. This raises their costs, reduces their margins and reduces their overall level of competitiveness. This backs up the free marketeer argument regarding regulation.

However, it could well be that the level of regulation is too lax and this means market failure still persists even post-intervention. As a result social welfare may improve but has not been maximised.

These two cases are shown below in a diagram:

One of the main issues with regulation, is how the government can effectively enforce this type of regulation, as effectively all that is passed is a law i.e. there is no guarantee that firms will abide by this new law. As a result, firms may sense their chance to withhold information from the government in order to avoid the financial punishments of failing to abide by the new regulations. Also, regulation can drive some firms to act collusively as they try to escape the excessive and out-dated red tape put on their costs. 

Also, the effectiveness of regulation will all depend on the ability of the firms in question to absorb the new laws. For instance, when considering regulation against pollution, the ability of firms to combat pollution creating activities must be taken into account. This is because not all firms can reduce pollution at the same cost as other firms because of the level of technology some firms have available to them. This makes it more challenging to setting the right level of regulation across all firms.

However, on a positive note regulation is quick, simple and easy to enforce when compared to other methods of government intervention and this allows the regulation to adapt to the changing landscape of the market when required, unlike taxes which can be a very complex policy to change in the economy. 


Regulatory Forbearance

Is when there exists a time inconsistency between setting successful and appropriate regulatory action i.e. what may be optimal ex-poste may not have been optimal ex-ante.

For instance if a large bank is close to failing due to holding insufficient capital, regulation states that the bank should be required to hold more capital to prevent systemic risk. However imposing large capital penalties on the bank could make the bank insolvent, dumping a huge cost on the taxpayer for the central bank to act as a lender of the last resort. Therefore regulators often to prevent failures do not implement tough restrictions when they are supposed too. However, this in effect creates a crisis of confidence amongst economic agents towards regulators and in the long-term increasing the number of bank failures. Below is the logical chain of reasoning for this type of regulatory inefficiency.


Relative Poverty

A relative measure when people earn a level of income significantly less than the average income for society.

Below is an illustration of how relative poverty classes someone as poor based on their household income relative to the average household income in the country. So this measure is not saying that individuals cannot afford a minimum standard of living but relative to the rest of the country they are in a worse situation.


Remittance

These are flows of money between individuals living in different countries. For example a foreign worker sending money back to their home country to support their family.

Below is the logical chain of reasoning for a remittance payments for a country and the positive side-effects that it could lead too i.e. an increase in the long-term standard of living.


Renewable resource

A resource that can be replaced or replenished as it is used e.g. timber and crops.

Rent

The reward for providing land.

Rented housing

An alternative to acquiring a property where tenants pay rent to acquire the right to occupy a property for a specific period of time. Payment of rent does not acquire any ownership rights

Representativeness Bias

People rely on this hueristic to make judgments, they are likely to judge wrongly because the fact that something is more representative does not actually make it more likely. For instance if a con had been flipped six times and the outcomes were as follows: HTHTHT. Many individuals would see that this does not represent a fair coin as the pattern is oredered too neatly and therefore make an incorrect judgement on the fairness of the coin.


Research and development economies

R&D often requires a minimum scale and the costs are relatively fixed while the benefits vary with output. This can achieve economies of scale for firms as they grow larger e.g. Apple.

Below is a diagram to show the level of R&D expenditure into UK businesses from the period 2009-13. This diagram shows that the pharmaceuticals industry appears to be the biggest recipient of R&D due to its heavy research into new drugs for medical use.


Reserve Requirement

Is the legally prescribed percentage of deposits that banks need to hold in reserve to meet losses stemming from liquidity problems. The more reserves that the bank is legally required to hold the smaller the rate at which they can create new money.


Restricted Choice

When the number of available options is removed and this leads to better and more efficient decision making as a result. For instance an opt-in pension scheme removes many of the internal complicated sub-decisions that have to be made which can often be frightening for decision makers and not lead to socially optimal outcomes such as the types of assets should they invest in and the risk level.


Retail Bank

Provides banking services to the household sector such as deposit-taking and lending activities.


Retail banking

When banks provide services directly to consumers and not to firms and other banks.

Retail Price Index (RPI)

A measure of inflation that reflects housing costs as well as the other goods and services measured by the CPI. It is used by the UK Government to index welfare benefits and is the longest standing inflation measure in the UK (since 1947).

Below is a diagram to show the historical change in RPI from the period 1989-2014 for the UK.


Retained profit

Any profit that is not paid to shareholders in the form of dividends. It may either be re-invested in the business or retained as savings.

Retention scheme

This is a method for supporting market prices by retaining or withholding production during periods of excess supply. Any retained supply is released during times of supply shortages e.g. OPEC.

Returns to Scale

Illustrates what happens to the level of output if the firm increases their inputs by a proportionate scale. There are three types of return to scale: Increasing, Decreasing or Constant. It is an indicator for a firm of how productive the scaling up of inputs has been.


Ringfencing

Occurs when a portion of a company's assets or profits are financially separated without necessarily being operated as a separate entity, normally for regulatory purposes.

For instance in the banking world ringfencing is carried out in universal banks to prevent losses on the investment bank activities affecting customers in the commerical bank side of the bank i.e. it is a succint way of structuring the bank to isolate risks and loses in each of the seperate activities that banks undertake. This is highlighted in the diagram below as the ringfence prevents losses from one subsidary of the bank affecting the others.


Risk averse

A person who actively seeks to avoid or reduce risks.

Risk taker

A person who who is not averse to taking risks and actively takes them.

Rose Effect

Is the perceived increase in intra-union trade that should occur when a country decides to become part of a single currency.

Below is the logical chain of reasoning for how the rose effect comes about for a country. The adoption of a single currency removes any instability by eliminating foreign exchange risk and therefore this encourages countries to invest and trade with each other, eventually making the net benefits for that country of joining a single currency greater. It was argued by Andrew Rose (the founder of this theory) that this effect could be as large as a 40% of GDP increase in trade.

Below is a diagram to show the net benefits increase that comes with higher intra-union trade.


Rule of Thumb

A mental shortcut which enables fast computation of a decision. For instance a decision that all agents have to make is 'how much to save?'. Clearly this depends on lots of different individual characteristics suc as income, future income, investment risks and so on. But if the individual had a rule of thumb to always save 10% of income this would remove any uncertainty in this decision process.


Satisficing

Satisficing is a decision-making strategy or cognitive heuristic that entails searching through the available alternatives until an acceptability threshold is met.

Below is an illustration that satisficing always leads to a choice which lies somewhere between a satisfying outcome and one which will suffice i.e. making the best decision a person can make. For instance, an individual wishing to purchase a high quality good with a low price will often find it very difficult to achieve this aim and therefore will often have to buy a high quality product at a price that will suffice or buy a lower quality version of the product that is still satisfactory.


Saving

Any household income that isn’t spent over a given period of time. This can be used to reduce debts or placed with financial institutions to create wealth for use at a future date.

Saving function

An equation that explains the relative influence of different factors on the savings of households.

Savings Bank

A financial institution that offers savings facilities to retail customers such as Lloyds TSB. These can also be called Thrifts or Savings and Loans institutions (S&L's).


Scarce resources

A resource which is fixed in supply and will eventually run out if it is used continuously.

Seasonal unemployment

When workers become unemployed due to a seasonal dip or reduction in production at a certain period of the year.

Below is a diagram to show the effects of this type of unemployment on the economy. The SRAS curve shifts inwards as temporarily workers become unavailable after periods of the year e.g. students have to return to education in September and therefore can only work full-time in the summer months. But this is only temporary and soon this effect gets reversed as workers make themselves available for the next seasonal time of the year e.g. Christmas time. So, in the long-run is there no change to the equilibrium as these effects roughly offset each other.


Second Degree Price Discrimination

Is when a firm decides to charge a different price for different quantities, such as quantity discounts for bulk purchases. For example a retailer that purchases a large quantity of goods from a supplier will often receive a large discount for buying in bulk to encourage the retailer to purchase more.


Secondary Market

A market where investors can purchase/sell securities or assets from/to other investors, rather than from issuing from companies themselves.


Secondary product

Goods that are manufactured from primary products.

Secured

When property deeds are assigned to the mortgagor until all interest payments and principal (amount loaned) have been repaid.

Secured Loan

A loan in which the borrower pledges some asset (e.g. a car or property) against the value of the loan, which then becomes a secured debt owed to the creditor. This is done in mortgage loans and car loans to ensure that borrowers have the correct incentives to repay the loan in full with interest.


Service

Is an intangible commodity e.g. banks offer lending services to borrowers.


Services

Is an intangible commodity e.g. banks offer lending services to borrowers.


Shadow Banking Sector

Financial intermediaries involved in the creation of credit, but are not subject to regulatory oversight e.g hedge funds. This sector is exponentially growing and in 2013 grew by $5 trillion to $75 trillion, making up on average 25% of all financial assets, roughly half of the banking system assets, and 120% of GDP. This is a worrying trend as lower capital regulation imposed on these types of FIs raises fears of more bank failures and systemic crises.


Share

Is a form of equity in which investors who purchase these shares receive a percentage of the ownership of the company, as well the guaranteed percentage of future profits the company earns. Unlike with bonds this investment from investors never has to repaid back directly at a fixed point in time, but the company has to sacrifice some of its ownership to raise finance through this channel compared to issuing debt.

Below illustrates the basic transaction of an investor buying shares in a bank. This is one of the main ways that a bank can raise finance for their asset creation like loans. However the more equity a company issues the less control over the operations of the business they have.


Shifts in demand

The position of the demand curve moves due to a change in one of the determinants of demand. Shifts can be positive (to the right) or negative (to the left). If demand shifts there is an equal change in demand at every price level.

Below is a diagram to show the two types of shift that can occur for the demand curve - an outward and inward shift. These shifts can occur because of a variety of different reasons i.e. a change in disposable income will either increase or decrease the amount consumers wish to buy at a specific price.

However, when evaluating a demand curve shift it is important to understand how significance the shift is. This is because some shifts may be small and therefore this will not have a significant impact on the price or quantity in the market. Whilst other demand curve shifts will be large and bring about large changes in the price or quantity in the market.

One of the most influential factors relating to how significantly a demand curve shift impacts the market equilibrium is elasticity. If the demand curve is  inelastic, then the demand curve shift will have a reduced impact on the quantity demanded, despite large price changes. However, if the demand curve is more elastic, then the demand curve shift will have a significant impact on quantity demanded, without large changes in prices. 


Shifts in supply

The position of the supply curve moves due to a change in one of the determinants of supply. Shifts can be positive (to the right) or negative (to the left). If supply shifts there is an equal change in supply at every price level.

Below is a diagram to show the two types of shift that can occur - an inwards and outwards shift. These shifts can be caused because of a variety of reasons. For instance if the cost of a raw material changes then this is likely to change a firm's supply decision as the more expensive a good is to produce, the fewer they will supply (inward shift). On the other hand, if a good is less expensive to produce, the more of the product they will supply (outward shift).

However, when evaluating a supply curve shift it is important to take into account the significance of the shift. This is because large supply curve shifts will have a larger impact on the market equilibrium compared to smaller supply curve shifts. The significance of the supply curve shift will also depend on the elasticity of the curves. As inelastic supply curves will have a greater influence on the price compared to the quantity. Whilst, elastic supply curves will have a greater impact on the quantity rather than the price. Therefore, these are evaluative points that should be considered when analysing a supply curve shift. 


Short run aggregate supply curve

Illustrates the positive relationship between real output and the price level.

Below is an illustration of the SRAS curve. It is upward sloping because if real output increases, more goods need to be produced but this can only occur if the price level rises. This is because production costs rise when output rises. So for more goods to be supplied this will require the price level in the economy to rise, as the higher production costs are passed onto the consumer in the form of higher prices.


Short-run

When at least one factor of production is fixed. For most businesses this consists of only being to vary labour in the short-run but not fixed inputs such as capital and land - where long-term contracts need to be drawn up.


Short-Run Phillips Curve

This is a curve that shows that there is an exploitable trade-off for the government when wishing to achieve employment or inflationary objectives. Therefore, the curve shows that changes in the level of unemployment have a stable statistical effect on the level of inflation in an economy.

It works this way because if there is a positive AD shift there will be a subsequent increase in demand for labour as growth puts pressures on firms to meet higher output demands. This causes the pool of valued and skilled labour to fall and therefore firms must compete over these scarce workers and this puts pressure on wages to rise. As workers realise they are more valued they hold bargaining power and drive up nominal wages. But as much as this is a benefit to workers, it causes firms production costs to rise and these costs eventually get passed onto consumers in the form of higher prices. Leading to the inverse relationship between unemployment and inflation. Below is a graphical depiction of the curve.


Shut down points

Represents the production point at which a firm is indifferent between shutting down and continuing to operate in the market. The optimal production decision of the firm at this point will all depend on the position of the individual firm's cost curves. This is because if the firm can acquire sufficient revenue at this point to at least meet their average variable costs, the firm would decide to stay in the market as any additional revenue over the variable costs can be used to cover part of the fixed costs of production. This runs on the assumption that when firms exit an industry the fixed costs must still be incurred.

If the firm produces below the shutdown point it will always cease production because the firm will not acquire enough revenue in order to cover the variable costs of production.


Signalling function of prices

Prices and changes in price signal information to consumers and producers of goods.

Social costs and benefits

Costs or benefits that are external to a transaction and not reflected in the equilibrium price and output. This means that some costs or benefits are imposed on third parties and too little or too much of a good/service will be produced and consumed. They can be positive or negative and are commonly referred to as externalities.

Social Norm

A society wide understanding that specific actions or views are either to be encouraged and discouraged. For instance the government often run anti drink driving campaigns at christmas to build up the social angst towards drink-driving. By implacing on society that it is an unacceptable action it discourages this action across society.


Socialism

Social ownership of the means of production and management of the economy.

Socially optimal output

The output level that reflects all the costs and benefits associated with a transaction i.e. it is the equilibrium that would be achieved if the market outcome reflects the effect of externalities.

Below is a diagram which shows a market that previously had negative production externalities in and ultimately a tax equal to the size of the divergence between the marginal private and social cost curves has removed the excessive production of this externality onto third parties. As a result the socially optimal level of output reached. This can only occur in a market with externalites if the marginal private and social curves are equal to each other for both the benefits and the costs.


Socially owned housing

Housing built and owned by local authorities or housing associations that is earmarked for rental to specific socio-economic groups.

Soft commodities

Are commodities that are agricultural products e.g. sugar, soya, wheat, coffee, fruit.

Soft landing

A slow down in economic growth that does not carry the risk of a recession. Normally associated with successful interventions to slow down the rate of inflation.

Solvency

The ability of a financial institution to ultimately repay obligations by a given time period. If a bank is classed as being solvent it means the value of its assets outstrip the value of its liabilities and therefore even if a bank runs into unexpected liquidity problems it has enough value to cover these liabilites to prevent problems and ultimately bankruptancy. Another way of describing this is if the losses that banks make on their assets exceed the level of equity capital they have then they are unable to act as a buffer stock to absorb losses.

Below is a graphic to summarise the definition of this form of protection for a bank.


Sovereign debt

A general description for loan agreements relating to money borrowed by governments. the sovereign debt of countries with strong credit ratings are referred to as gilt edged.

Spare capacity

Highlights the extent of how far away an economy or firm is from producing at its maximum feasible production level. The spare capacity refers to resources which are not being fully utilised in the production processes of firms and this explains why output lies below the maximum level. 

If an individual firm has spare capacity this means the factors of production (labour, land, capital and enterprise) are not being used in the most efficient way and this reduces the ability of firms to produce at their maximum level. The implications of firms having a significant level of spare capacity is that they are likely to face an inelastic supply curve i.e. restricted in their ability to increase production when prices rise. This inelastic supply will then go on to impact the firms profitability. 

From an economy's perspective, if spare capacity exists this relates to the total economy's endowment of resources not being fully utilised in the most efficient way possible. As a result the firm is producing at a level below its productive capacity and is classed as productively inefficient. 

The cleanest way to evaluate spare capacity in the economy is to use the Keynesian aggregate supply curve. As this curve shows that the AS curve for an economy is upwardly sloping. It shows as the economy moves closer to full employment the AS curve becomes more inelastic. This means the impact of aggregate demand curve shifts on the inflation rate becomes amplified the less spare capacity the economy has, because the increased demand cannot be absorbed by spare resources. The evaluative point here is that the more spare capacity an economy has the less of an impact AD curve shifts have on the inflation rate.

Below is a depiction of the Keynesian AS curve for an economy that is positioned at a point with significant spare capacity.


Specialisation

By working with other workers and dividing up the tasks involved in production the overall productive process becomes more efficient because specialisation helps the workers to become more proficient in a smaller number of tasks.

For instance, rather than all villagers carry out all tasks it would be much more beneficial for the entire village to divide specialised tasks to individual villagers. This way each villager would become more focused and more skilled in that particular practice because of the 'learning by doing' approach. This is the basic concept invented by Adam Smith and his idea of the pin factory to increases productivity and efficiency in the production process.


Specific tax

A tax per unit of consumption that does not vary with the value of consumption. The fuel duty on unleaded petrol is currently 58p/litre (n.b. also subject to VAT which is an ad valorem tax).

The following table and diagram detail a specific tax of £2.00:


Speculation

Investing when there is an expectation that prices will rise and produce a profit.

Speculative demand

The decision to buy a good is based on the expectation that the prices are expected to rise rather than for the purpose of consuming the good itself. The goods are typically held for a short period and the sold to make a gain. This activity is common in commodity markets.

Spillover effect

An outcome of economic activity that effects firms and individuals that are not directly involved in an activity e.g. externalities.

Spot Contract

The immediate exchange of one currency for another using the current exchange rate, which has been determined by demand and supply for those respective currencies in the foreign exchange market.

Below is a diagram to show that this type of contract takes the exchange rate that prevails in the market for that particular currency i.e. where demand and supply for that currency intersect.


Stabilise prices

Government intervention designed to manipulate markets to prevent excessive price fluctuations

Stagflation

A term used to describe an economy that is experiencing anaemic growth, rising inflation and high levels of unemployment.   

Below is a series of diagrams to show how to represent the economic impacts of stagflation for both the economy and the labour market.

Stagflation is created as a result of an inward shift in the SRAS curve, as shown in the AD-AS diagram above. This inward shift is an example of a supply side shock as is normally instigated because of an increase in production costs such as commodity prices or wage costs. Another term that could be used to describe stagflation is cost push inflation. 

Because the stagflation has created lower output (as a result of firms curtailing production). This means value of labour for firms is reduced and therefore this causes an inwards shift in the demand for labour curve in the labour market. Assuming ceteris paribus, this results in reduced employment and creates rising unemployment in the economy. 


Stakeholder

All relevant parties who have a vested interest in the operation and results of the business.

Below is an example of some of the economic agents who have a clare interest in the economy. Shareholders are concerned with the profit performance of the company. The management team are concerned with the organisation of the company to ensure the most efficiency, as well as internal goals to elevate their reputation. Staff are interested in personal performance to ensure a bonus or promotion. The government are interested, as the more susccessful the company is the more competitive the economy becomes on an international stage. Customers and the local community provide the demand and factors of production for the production process so are crucial to both the consumption and creation of products.


State provision

Services provided by central government and paid for from tax revenues e.g. flood defences, policing, education and health services

Static efficiency

A situation where resources are allocated efficiently at a specific point in time. An example of this would be to question whether a firm could produce 2 million cars a year more cheaply by using more labour and less capital.


Static Expectations

When economic agents form their inflation expectations on the basis that nothing in the economy changes i.e. they ignore the fact that inflation can change.


Static model

A model that considers a particular issue at a set point in time.

Steady inflation

Prices rise in a steady and consistent manner without ever rising rapidly. This is the target of most economies as a consistent and modest rate of inflation encourages consumption and investment.

It is important when evaluating the inflation rate in an economy, to judge how quickly the inflation rate is rising. This is because the impact on economic agents from inflation depends on the type of inflation in the economy

  • Rising and volatile inflation is bad for the economy as it creates uncertainty and reduces confidence, consumption and investment
  • Modest, steady and consistent inflation creates macroeconomic stability and encourages economic activity such as consumption. 
  • Low and falling inflation raises fears over deflation and this discourages economic activity as economic agents await further price falls.

Below is a diagram to depict controlled and steady inflation in an economy. In this situation the economy is below full employment and therefore has a significant amount of spare capacity available. This means a positive aggregate demand curve shift  does not raise concerns about the inflation rate as a result of the economy being below full employment. This type of inflation is not damaging and this highlights the role of the MPC to ensure that this type of steady inflation is met and it does not escalate to runaway inflation. 

In an exam if you are evaluating inflation rate increases, the position of the economy (level of spare capacity available) will affect how the inflation rate increase is perceived in the wider economy.


Stock

Is the accumulation of wealth contributed by continous flows. A stock is the opposite of a flow as it is very rarely spent and is made up of assets that are not very liquid. The idea of a stock can be thought of as a bath tub with water inside it (stock) and the flow of water from the tap (flow) adds to the already accumulated water. Just like an income does to a person's wealth.


Store of Value

A liquid store of value provides individuals with the ability to accumulate their wealth in any form, at any time can convert this money instantaneously into goods and services. This is one of the three functions of a successful and efficient monetary system, alongside a medium of exchange and a unit of account.


Structural unemployment

When production in a particular industry ceases due to long term changes in demand or production techniques. This type of unemployment can persist for long periods if an industry accounted for a large proportion of jobs in a particular region as this means there will be relatively few alternative jobs for workers to turn their skill sets to. 

Below is an illustration of the impact of structural unemployment on the economy. For example if a steel company closed down in the UK this is likely to make lots of people unemployed for a long period of time, because these workers might not be able to afford to migrate to other parts of the country to take work in a new steel mill or workers skills become defunct and they struggle to settle into another industry. As this shrinks the capacity of the economy it causes the LRAS curve to shift inwards and creates a permanently higher level of unemployment.


Subsidies

Payments made by governments to suppliers to encourage the supply of particular goods. This is common in agricultural markets and goods with environmental benefits.

Below is a diagram to illustrate a market which has had the benefit of a government subsidy. In this instance, the subsidy encourages producers to produce more goods causing the supply curve to outwardly shift. This is because the costs of production have fallen due to the money from the subsidy. However, this creates excess supply so the price has to fall in order for the market to clear and this causes the amount of goods sold to increase as lower prices fuels higher demand.


Subsidy

A payment made by governments to suppliers to encourage the supply of particular goods. This is common in agricultural markets and goods with environmental benefits.

Below is a diagram to illustrate the impact of a subsidy being given to farmers in the potato market. In this instance, the subsidy encourages producers to produce more goods causing the supply curve to outwardly shift to S1. This is because the costs of production have effectively fallen, as the subsidy provider (government) has paid part of the cost of production. The impact this has on the market is that it encourages producers to produce more of the good they are producing, shifting the supply curve to S1. This creates excess supply in the market and puts pressure on the price to fall in order for the market to clear (as the demand curve has remained unchanged) and this causes the amount of goods sold to increase as the lower price fuels higher demand.

Subsidies are used predominantly by the government to reduce or remove externalities (dead weight loss triangle) that exist because of under-consumption and under-provision of a good i.e. positive consumption externalities, positive production externalities and merit goods.

However, when evaluating the effectiveness of subsidies it is important to take into account the price elasticity of demand. The more inelastic the demand curve the greater the price fall in the market. Where as with an elastic demand curve, the price fall is smaller as producers do not pass a large percentage of the subsidy onto consumers.


The degree of elasticity also affects who benefits from the imposition of a subsidy. The more inelastic the demand curve, the greater the benefit for consumers as a large percentage of the subsidy is passed onto consumers via a lower market price. However, when the demand curve is elastic, the smaller the price fall and the smaller the subsidy gain for consumers as a result of a smaller price fall. Conversely, producers take most of the subsidy benefit when the demand curve is elastic, as they keep hold of much of the cost savings from the subsidy. Below is a set of diagrams to show how the incidence of the subsidy (producer and consumer benefits) depends on the elasticity of demand. 


Despite all of this, it is much harder in reality to grant an industry a subsidy, as governments do not know the precise size of the externality in the market. This is because externalities are difficult to value and therefore the governments attempts are just estimates of the value of the externality. These estimates are unlikely to be precisely accurate as some goods may exhibit different externalities when consumed or produced by different agents. All of this means making a decision about providing a subsidy or the size of a subsidy is difficult.


Substitute good

A good that satisfies similar needs and may be consumed as an alternative to another good e.g. olive oil spread instead of butter.

Below is a diagram to show two goods that are substitutes. Therefore consumers perceive these products as practically carrying out the same function as each other. Therefore if there are price changes this will affect the demand of both products. If Good B's price rises this causes consumers to switch towards the cheaper product i.e. Good A. Therefore this diagramatically is represented by an outwards shift in Good A's demand curve at any given price.

If Good B's pricefalls this causes consumers to switch expenditure away from Good A as that is more expensive compared to Good B. Therefore this diagramatically is represented by an inwards shift in Good A's demand curve at any given price.


Substitute goods

A good that satisfies similar needs and may be consumed as an alternative to another good e.g. olive oil spread instead of butter.

Below is a diagram to show two goods that are substitutes. Therefore consumers perceive these products as practically carrying out the same function as each other. Therefore if there are price changes this will affect the demand of both products. If Good B's price rises this causes consumers to switch towards the cheaper product i.e. Good A. Therefore this diagramatically is represented by an outwards shift in Good A's demand curve at any given price.

If Good B's pricefalls this causes consumers to switch expenditure away from Good A as that is more expensive compared to Good B. Therefore this diagramatically is represented by an inwards shift in Good A's demand curve at any given price.


Substitutes

Goods that satisfy similar needs and may be consumed as an alternative to another good e.g. olive oil spread instead of butter.

Substitution effect

When the demand for a good changes after a price change because any substitute good will become more or less attractive if their price does not change by as much.

Sunk Cost

Costs which cannot be recovered if the firm decides to leave the market.

Below is a list of examples that can lead to unrecoverable costs arising. When firms invest in capital, this capital is subject to depreciation and as a result this piece of capital loses its value over time. This is unrecoverable as there exists no firm that would be willing to buy this unit of capital at its original price as it has depreciated over time. Advertising costs are also unrecoverable as these costs never get made back, indirectly it may help boost the firm's level of profit but the firm can never make this money back. Finally niche pieces of capital that are uniquely built for the specific production process of a firm are unlikely to provide any value and use to other firms and hence this capital cost can never be recovered as it can never be re-sold.


Supernormal Profit

Often called abnormal profit, is when a firms total sales revenue exceed the total costs of production i.e. they are earning a profit above and beyond the level of normal profit. This is the level of profit that a firm can enjoy after meeting the main production costs.

The diagram below illustrates how a monopolist exploits its monopoly power to enjoy supernormal profits. By charging a price above the marginal cost the monopolist extracts a level of sales revnue equal to the blue shaded box (P*Q). However, this is not the level of profit that firms receive as they have to cover the costs that go towards producing this product i.e. normal profit. Once the costs have been taken away from the sales revenue, any revenue left over is counted as supernormal profit - as this is the money that firms are able to use flexibly for any part of the business.


Supply

The amount of a good or service firms plan to supply to the market at a given price over a certain period of time.

Below is a diagram to show the supply curve for a good in a specific goods market.


Supply side economics

Issues that impact the supply of goods and services in the economy. This covers a wide range of issues including business taxes, education, migration, support to encourage research and development, subsidies and grants for vulnerable industries and businesses and laws regulating economic activity.

Below is an example of the two schools of thinking behind supply-side economics. The first is the classical view that there is a shift in the LRAS curve which expands the productive capacity of the economy. Then there is also the keynesian viewpoint that the supply curve which has many elasticity points shifts outwards.


Supply side fiscal policy

Government policies and initiatives that aim to increase the productive capacity (supply side) of the economy. The policies will shift long run supply curves to the right and are important to produce sustainable economic growth.

Below illustrates an expansionary supply-side policy which has successfully caused the LRAS curve to expand and therefore produce a form of sustainable growth as the productive capacity of the economy has expanded preventing any inflationary problems.


Supply Side Policy

Initiatives that are intended to increase the economy's ability to produce goods and supply goods and services by creating incentives for economic agents to work, save, invest and be entrepreneurial i.e. increase the productive capacity of the economy.

The type of supply side policies implemented depends on the economic school of thought policymakers belong to. There are two types:

  • Free Marketeer
  • Interventionist

These initiatives if implemented in the economy, will create an expansion in the supply curve in the long-run, from a classical perspective this will be an outwards LRAS curve shift and in the Keynesian case it will be an expansion in the Keynesian aggregate supply curve. 

Assuming ceteris paribus, from both economic schools of thought the impact on the macroeconomic equilibrium will be for the price level to fall (inflation decelerates) and real output to increase.

These policies will help the government achieve some of their macroeconomic objectives in the long-run. Inflation will be lower as the economy becomes more efficient and productive and this helps drive costs down. Deregulation is an example of a supply side policy which can help remove constraining regulations on firms, reducing their costs. The lower costs incentivise firms to produce more and eventually these get passed onto consumers. Hence the reduced inflationary pressures in the long-run

Economic growth becomes sustainable as there is an increase in the productive capacity of the economy, which means resources do not become stretched despite higher output. For instance, privatisation can increase the size of the private sector and this will increase the level of entrepreneurial activity in the economy. This enterprise fuels hgreater economic activity without the onset of inflationary pressures. 

Unemployment is reduced as supply side policies can help remove labour market frictions and also improve the level of labour mobility in the economy. For instance, a policy to increase spending in education and training to improve skills and flexibility, will lead to long-run gains in labour productivity, which ultimately makes workers more valuable to employers. These policies in the long-run help to reduce the natural rate of unemployment.

It is important to also consider the impact that supply side policies have on the current account on the balance of payments for a country. If the economy increases its productive capacity, the lower price level will increase the competitiveness of a country's exports and this in turn should lead to an improvement in the current account position of a country. But this is subject to a few other factors such as: relative inflation rate with other countries, PED of imports and exports and the significance of the decelerating inflation rate.

However, as with the case of other economic policies, the impact and effectiveness of supply side policies on the real economy is not always an exact science. So you need to be able to evaluate these policies when dealing with an exam answer. The evaluation points around supply side policies relate to:

  • Magnitude and duration of impact?
  • Timing of impact?
  • Certainty of impact?
  • Ease of administration?
  • Equality impact?

For instance, certain supply side policies can involve significant time lags and therefore the duration and timing of the impact can depend on the type of policy implemented. For example, policies targeted towards education and training - which aim to increase the level of human capital - are likely to take 10-15 years to feed through benefits to the economy and therefore unemployment may not be significantly affected.

Also, supply side policies can be difficult for the economy to implement compared to a conventional monetary policy, in which a decision to change interest rates can be made monthly. 

Supply side policies can also have an adverse impact on the distribution of income and wealth because these policies can create a greater divergence between the wealthiest and poorest individuals. 

Therefore, as a result of some of these uncertainties, supply side policies are normally used to complement demand side economic policies (monetary and fiscal policies) to reach the desired outcome of the government i.e. sustainable economic growth. 


Supply side shock

A sudden, unexpected and significant change in the cost of a factor of production, such as changes in wage rate, commodity prices or taxes, that causes a shift in the aggregate supply curve.


In the diagram below this displays a negative supply shock in which causes the supply curve to shift inwards and this creates a negative output gap. This could of been caused by an increase in the price of a key raw material used in the production process to produce this type of good.


Sustainable economic growth

An important term indicating a rate of economic growth, which will continue in the long run and is unlikely to fall back to a lower level in a short period of time.

Below are a set of diagrams to show the impact that sustainable economic growth has on an economy. In this instance, the sustainable part of the term refers to the fact that the growth and higher output should be able to be maintained because of the increase in the productive capacity, like at point D. As a result no inflation is created.

If this LRAS curve shift was not achieved then the economy would be in a boom position. This boom period is temporary because the economy cannot continue to produce output equal to Y2, as they have insufficient resources to do so. Eventually, pressures on the factors of production (e.g. labour) forces the cost of production up (e.g. wages) and these higher costs gets passed onto the consumers via higher prices. The price level in the economy adjusts to P3 to take pressure off the economy.

In a data response question it is important to be able to decipher whether the introduction of an economic policy creates unsustainable or sustainable growth. This will help you evaluate the impact of the policy on the important macroeconomic variables.


Systemic Risk

The risk that the failure of one or more troubled financial intermediaries could trigger a contagious collapse of otherwise healthy firms.


Tacit Collusion

Is where firms follow a mutually beneficial, co-operative strategy without explicitly agreeing to do so. This type of collusion is more common amongst firms because collusion is strictly prohibited, this is seen as a more subtle way of colluding with firms and therefore a higher probability of avoiding detection.

Below is an example of the most common form of this type of collusion - price leaderhsip. This is where one firm takes up the role of the price maker, often called the 'leader'. Once this firm has set the price all the 'follower' firms then match this price. Firms can enjoy supernormal profit using this method because the 'leader' sets an extremely high price, that normally in the market would get undercut by rivals. But as all firms agree to match this price, consumers are forced to buy this product at a high price from any of these firms if they desire the good being sold in this market. As this is a form of collusion it is legally prohibited and often individual firms have an incentive to cheat to capture the entire market and steal supernormal profits. The logical chain of reasoning of this pricing strategy is shown below.


Takeover

This is the purchase of one company by another company. This is a way that companies can expand their business operations and branch into markets that previously they have found difficult to break into. For instance in November 2015 Activision bought King Digital (creator of app Candy Crush) for $5.9bn to help Activision to help become successful in the smartphone market.


Tax burden

This is equal to the loss in welfare associated with an indirect tax.

The tax burden imposed on society will depend crucially on the elasticity of the demand curve facing the market. As the less price sensitive consumers are the more of the tax that can be passed onto them in the form of higher prices as it will increase their level of profit despite price rises due to a lack of drop-off in demand.

Below is a diagram to illustrate how the imposition of an indirect tax implaces a burden on society. In this instance the demand curve is neither inelastic or elastic and therefore the tax burden is split evenly between the consumers and producers. It implaces a burden on society equal to the combined amount of producer and consumer burden.

Below is a diagram to illustrate when the demand curve is inelastic and therefore the tax burden is split unevenly towards consumers ahead of producers. It implaces a burden on society equal to the combined amount of producer and consumer burden.

Below is a diagram to illustrate when the demand curve is elastic and therefore the tax burden on producers is small. It implaces a burden on society equal to the combined amount of producer and consumer burden. An elastic demand curve seems to implace the smallest burden on society due to the fact that the firm has to absorb most of the tax.


Tax revenue

The amount of money raised by the imposition of a tax i.e. number of units sold x the tax applied to each unit sold.

The diagram below shows the amount of tax revenue a government earns from an indirect tax is equal to the green shaded region. The tax value is just the difference betwen the two supply curves.


Taxes

Deductions from income or additions applied to the cost of transactions to collect revenue to fund government expenditure.

Technical economies

These are advantages that large firms experience because of increasing and decreasing returns to scale i.e. can buy more efficient equipment that produces lower unit costs, can specialise more and can benefit from the law of increased dimensions.

Technical economy of scale

These are advantages that large firms experience because of increasing and decreasing returns to scale i.e. can buy more efficient equipment that produces lower unit costs, can specialise more and can benefit from the law of increased dimensions.

Technical efficiency

When a quantify of output is produced using the smallest possible amount of inputs.

Technical progress

When the state of technology changes e.g. when cars started to replace horses and when e-mail started to replace traditional mail.

Technology

Is the collection of techniques, skills, methods and processes used in the production of goods or services.


Term

Definition

Terms of Trade

The relative price of a country's exports in terms of imports and is defined as the ratio of export prices to import prices. It can be interpreted as the amount of goods a country can import per good that is exported i.e. how much the revenue received from each exported good can buy in terms of imports.

For instance if the average price of exports rise relative to import prices there has been an improvement in the terms of trade - a unit of export buys relatively more imports. Likewise if import prices fall relative to export prices. Therefore if a country's terms of trade improve it is either because the average price of their exports have increased or the average price of their imports have fallen as the diagram below shows.


Tertiary sector

This sector distributes primary and secondary products and provides services.

The Chancellor of the Exchequer

Is a UK government cabinet position with responsibility for financial and economic matters. The post is currently occupied by George Osborne.

The Economic Problem

Is one of the fundamental economic theoretical principles in the operation of any economy. It asserts that any economy has a limited amount of economic resources (factors of production) at its disposal and therefore producers need to identify the best way of allocating these scarce resources to best satisfy the infinite needs and wants of consumers across the economy. This all runs on the basis that consumers tastes and preferences are ever-changing and producers need to find the best way of diverting a finite amount of resources to the goods and services which hold the greatest value and importance to consumers. Therefore, the economic problem is driven by two concepts; choice, and scarcity. Producers have to make tough choices by prioritising the human wants that can be fulfilled alongside what is feasible for them to produce given those scarce resources. Each choice represents an opportunity cost for producers due to the scarcity of these resources. The ability of producers to achieve the optimal allocation of resources can be best represented by looking at the PPF of any economy.


The General Theory of Employment, Interest and Money

Was written by John Maynard Keynes. Its main idea was that markets will not deliver efficient outcomes if there is minimal intervention. His view was that without proactive demand side fiscal policy, markets will deliver under employment and investment.


The Quantity Theory of Money

Is a classic monetarist inflation theory established over 500 years ago, that states increases in the price level are solely determined by increases in the money supply. This theory is the core of monetarism.

The theory's prediction can be best shown via the Fisher Equation. This equation is an adaption of the equation of exchange and is named after the American economist Irving Fisher.

Now there are a few assumptions that monetarists impose on the equation in order for the theory and the subsequent results to hold. The most important of these assumptions is that T and V are always assumed to be constant values in the short-run at least. Monetarists particularly stress V is held constant because the demand for money is a function of income and this does not immediately change in the short-run from a change in M. Based on this assumption the equation cancels down to:

However, this assumption of a constant velocity of circulation in particular is often a sticking point for opposing Keynesian economists. This is because they argue that V must change even in the short-run because it is determined by human spending impulses from consumers and firms, which to assume is constant is illogical in their eyes. For instance, if the money supply is increased then the base rate must be changed and by doing so this affects economic agents demand for money (liquidity preferences).

If we take the monetarist assumptions as given and we get the simplified equation of M=P, any permanent change in the money supply creates an equal permanent change in the price level i.e. if the money supply doubles then the price level will double.

The mechanism of this inflation theory can be represented with the following graphs below:

At period t1 the initial increase in the money supply causes the amount of money circulating in the economy to permanently increase from M1 to M2. This immediately causes the velocity of circulation to fall by an equal factor (V1 to V2) temporarily as each unit of currency does not change hands as many times within a year now there is more money circulating around. However, as the extra money begins to be spent by consumers the number of transactions (T) in the economy starts to gradually rise over time and this creates pressure for price level to rise over time (P) as a result of demand-pull inflation. As a result of more transactions being conducted in the economy, this starts to cause the velocity of circulation to rise over time as consumers make more transactions. But, as the price level rises this causes the number of transactions to fall back to its original level, which also means V also falls back to its original level, as consumer real incomes start to fall back to their original levels. So at the final equilibrium there is a higher price level with the same values for V and T.

The results of this theory can be represented in an AD/AS framework:


Assuming no accompanying LRAS curve shift is created this creates demand pull inflation and this can lead to an inflationary spiral, which is not always a problem for the economy, as this type of inflation arises from higher consumption, economic activity and results in growth. But, it is important to note that if the inflation rate becomes too high and volatile it becomes unhelpful as it undermines confidence and competitiveness in the long-run.

When evaluating the Quantity Theory of Money it is important to consider the following points:

  • Accompanying Productivity Changes e.g. An outwards LRAS curve shift will create dis inflationary growth and will cause the predictions of the model to break down.
  • Confidence Levels e.g. The theory assumes that consumers will always spend idle cash balances but they may prefer to hold onto cash balances.
  • Level of Spare Capacity e.g. AD expansion may be absorbed and not create inflation if the economy is operating below the full employment level.
  • Reverse Causation e.g. Money supply may accompany inflation rather than cause it. 


The Ultimatum Game

Is a game in economic experiments to provide key insights into the pshycological behaviour of an individual.

It works by one player being offered a sum of money. Immediately afterwards they are required to make a second player an offer and if that player accepts the offer he must hand over the amount prescribed in the offer, leaving the original player with the left-overs. However, if the second player rejected the offer because it was too low then both players walk away with nothing. So the first player needs to offer the second player an offer that he will not be able to refuse. However, economic theory suggests that the game should be played by the first player offering the second player $1 and he should then accept it. As it would be the lowest amount the first person can give away and the second player will not turn any offer of money down, making it a mutually beneficial offer. But often a perception of fairness evolves and takes over and the first player offers the second player a much fairer allocation of the sum of money. This is shown in the logical sequence below.


Third Degree Price Discrimination

Is when firms charge a different price to different consumer groups. This is a very common form of price discrimination. For example this is done when cinema tickets are sold in which adults have to pay more compared to children.

Below is a table to show a firm that engages in this form of price discrimination in which those who value the good highly i.e. those that are paying £40 or more are charged £40. Whilst those that value it less i.e. those who value it below £40 get charged £20. Therefore in this case the firm has segregated the market into two different markets - high and low valuation.

Here is a graphical representation of the firm splitting the market into two different forms and therefore they face a kinked demand curve. Inelastic demand curve for high prices in market A and and elastic demand curve for low prices in market B.


Third parties

A person or individual not directly involved in an action, transaction or agreement.

Third party

A person or individual not directly involved in an action, transaction or agreement.

Tier 1 Capital

Is the amount of capital that banks need to hold to comply withe BASLE capital adequacy requirements. This capital is the core measure of a bank's financial strength from a regulator's point of view. It is composed of core capital, which consists primarily of common stock and disclosed reserves. According to the current version of BASLE (BASLE II) banks must hold at least 50% of the 8% capital in tier 1 capital.


Tier 2 Capital

Is supplementary bank capital that includes items such as revaluation reserves, undisclosed reserves. A bank's reserve requirements includes this capital in its calculation, but it is considered less reliable than its Tier 1 Capital.


Tight labour market

When an economy is close to full employment and recruitment becomes difficult placing upward pressure on wages.

Below is a depiction of what happens in the labour market of an economy that is close to full employment. Once an economy aproaches full employment more output needs to be made in order to meet ever-increasing demand for products. However, if the economy is close to full employment extra labour cannot be hired easily as the pool of available workers is small. Therefore the aggregate demand for labour curve shifts to the right as firms would like to employ more workers but the supply is not available. Ultimately this excess demand causes existing workers wages to steadily rise as workers now hold higher bargaining power. This is shown in the diagram by moving to point C at a higher wage rate of W1 to cancel out the excess demand for labour.


Tight monetary policy

When monetary conditions are adjusted to counteract inflation e.g. base rate rises and tighter regulation of banks.

Below is a diagram to show when there is unsustainable growth and runaway inflation, a cut in the bank rate will contract the aggregate demand curve in order to restore full employment and ensure the target CPI inflation rate is met.


Too Big To Fail Policy

This is the moral hazard problems that are created in the financial sector when large financial institutions (in terms of asset value) realise that any losses they make will be paid by the taxpayer they increase their propensity for risk. For example in the case of Northern Rock the Bank of England provided them with a £3bn bailout to keep them alive. However if large banks receive the guarantee that they will always be bailed out they have no incentive to stave off losses.


Total Costs (TC)

The sum of all costs of production.

Below is a diagram to show that the total cost curve is derived from the total variable cost curve and total fixed cost curve. As these are sepearate costs that face the firm, if at each output level both of these costs are added up the total cost for each level of output can be calculated and by connectng all of these points together the total cost curve can be derived, as shown below.


Total factor productivity

The efficiency of the productive process usually determined by measuring the units of output produced by all factor inputs. Increasing productivity is usually associated with periods of economic growth.

Total Fixed Costs (FTC)

The sum of all the fixed costs such as rent, loan payments and salaries.

Below is a diagram to show an example of a total fixed costs curve for an individual firm. As can be seen this curve is perfectly horizontal because these costs do not change regardless of how much output is produced and therefore this line will indefinitely continue until the firm either has a reduction or increase in the amount of fixed payments such as rent on a building.


Total revenue

The total revenue produced by the sale of a good. It is equal to the market price x the number of units sold.

Below is a diagram to show the level of revenue that a monopolistic firm makes. As can be seen this blue shaded region is equal to the market price multiplied by the quantity of goods produced. The level of sales revenue in this instance is quite large as the monpolist has significant market power and can charge a price above the marginal cost curve.


Total Variable Costs (TVC)

The sum of all the variable costs of production, such as materials, wages and transport.

Below is a diagram to show an example of a total variable costs curve for an individual firm. As can be seen this curve is linearly increasing at a proportionate rate because these costs are linearly increasing when more output is produced and therefore this line will indefinitely continue until the firm either has a reduction or increase in the amount of variable payments such as the amount each worker is paid or ho many workers they decide to hire.


Trade Creation

Trade creation is the term given to the increase in economic welfare that comes from a removal/reduction in trade barriers between countries. The increase in economic welfare is stimulated by a reduction in the price at which goods can be imported into the economy. Lower prices enable consumers to purchase and import more and result in consumption increasing (welfare gain). The efficiency of the market also improves due to inefficient domestic production being replaced, to some degree, by production from the most efficient producers. This improvement in efficiency, in turn, benefits the consumers in a particular market (welfare gain).

It is important to be able to visualise the impact of trade creation on any particular market which is subject to trade barriers. Below is the market for a particular commodity, with the welfare implications under an import tariff and under free trade (removal of tariff):

Tradecreation

The removal of the import tariff forces the world supply curve of the commodity back down to SW and forces the price down to PW. At this price, foreign producers have more influence over the domestic market and more foreign goods are imported by domestic consumers (Q- QS). The welfare implications of this are that the two deadweight loss triangles are eliminated and transferred to consumers via an increase in consumer surplus (due to an increase in quantity demanded and a fall in price). The tax revenue box is also transferred from the government to consumers on the basis of the same logic. This diagram shows how the removal of a trade barrier has resulted in trade being created in the market and has resulted in an improvement in total welfare. This describes the economic rationale behind joining a free trade area such as the European Union.


Trade credit

When a supplier allows a customer to take possession of goods before actually paying for the goods.

Trade Diversion

Trade diversion is the term given to the negative trade implications that occur when a country joins a customs union or free trade agreement. The logic is that by joining the customs union, a country will have to import goods from a less efficient country due to the common external tariff that is imposed on goods traded outside of the union.

To explain this process let's consider a simplified example of a country joining the European Union. Before joining the union, the country could import a specific commodity from the United States at the price of PUS. This results in a large number of imports from the US (Q2 - Q1). However, after joining the union, a common external tariff is applied to any goods being imported from the United States. This forces the US supply curve up to SUS+T and the new US imported price is equal to PUS. This means now that the cheapest import option available to domestic consumers is to import the commodity from other EU countries. The price of PEU is lower than the price of importing the good from the United States under the common external tariff, but is above the actual price of the US commodity. This means joining the customs union, has diverted trade away from the US to the EU and overall trade has fallen in this particular commodity. This can be represented  by a net loss in economic welfare, as shown by the orange shaded region below:

Tradediversion


Trade in goods

Goods that are made in one country and sold in another.


Trade in services

Services that are performed by one country for individuals and firms in another country.


Trade union

An organisation established for the welfare of workers and to negotiate collectively with employers on their behalf e.g. UNISON represents public service employees and the NUT represents teachers.

Below is a diagram to show the effect that a union would have on a perfectly competitive labour market. The union would force the wage rate above the prevailing wage rate. This will create an excess supply of labour which would later turn to unemployment as firms become reluctant to take on workers who demand higher wages. So perversely the union has increased the level of unemployment in the labour market.

Trade unions though can sometimes increase the level of employment in the industry particularly in industries where there is only one buyer of labour i.e. a monopsony. In the diagram below as long as the trade union employs a wage rate between w1 and w3, employment will increase, due to the unique nature of a monopsonist's steep marginal cost of labour curve.

However, if the trade union places too high a wage rate in the labour market i.e. at w4. Then employment will be reduced and the trade union has increased the level of unemployment in the market by creating unsustainable wage rates.


Tragedy of the commons

The depletion of a freely accessible resource because a rational individual will base usage decisions on their own self interests even if they know that the cumulative effect of everyone’s actions are depleting the resource. For instance, in the fishing industry each fisherman has an incentive to maximise their own profits by catching as many fishes as possible in the sea, as this is a public resource and does not have clearly defined property rights. However, if each fisherman does this then eventually the sea will become depleted of this type of fish and the industry will suffer.


Transfer payments

Income which is not associated with the productive process and is funded by deducting taxes from the economically active and transferring this to the economically inactive via the welfare system e.g. unemployment benefits and pension payments.


Transmission mechanism

A model that explains the impact of monetary policy on an economy. Below is a simplified version of the transmission mechanism to identify the main channels in which a change in the base rate ultimately affects the economy.

First of all it is important to identify that when the base rate changes this also affects all the other interest rates in the economy - both short and long-run - which will make changes to the availability and ease at which businesses and consumers can acquire credit. For instance if the base rate is cut this should lead to cheaper borrowing from banks to customers. Which in turn fuels higher consumption and investment contributing to higher demand.

This base rate cut will also cause asset prices to surge as asset's become more valuable when deposit interest falls.

A cut in the base rate also causes the exchange rate to depreciate and the domestic currency gets weaker relative to foreign currencies because of hot money flows out of the economy. This makes exports cheaper and imports more expensive, boosting a country's trade position and AD.

All of these effects accumulate and create inflationary pressures in the economy. Higher interest rates will have the opposite effect and will reduce inflationary pressure. Central bank's are able to influence the rate of interest in the economy and use this as the main policy tool for regulating the rate of inflation.


Trend Rate of GDP growth

This is the average growth rate in real GDP over a period of time.

Below is an illustration of the theoretical growth rate for an economy in its economic cycle. This the level of GDP growth that a country should be achieveing if the peak and trough phases of the business cycle have been averaged out.

Between 1948 and 2012 the UK economy has achieved trend growth of 2.6% p.a. compound. The highest annual rate of growth was 7.4% in 1973 and the lowest was -5.2% in 2009.


Trilemma

This represents the difficult choice that all policymakers face when setting domestic policies. That is, many countries would consider it desirable to have a fixed exchange rate, capital mobility and monetary policy autonomy, butis it is only possible to achieve two of these objectives.

The diagram below illustrates the trilemma and the fact that policymakers face a trade-off between these policies and the optimal decision to make would be to sacrfice the least beneficial objective given their particular circumstances. The logic with the diagram is that the policy objective that a country decides to pick the opposite corner of the triangle to that objective mst be sacrificed whilst the two adjacent policies to this objective can be take on.

For instance if a country wanted to pursue a fixed exchange rate i.e. goal 1. Then they would have to sacrifice having a floating exchange rate whilst at the same time having to implement capital controls and losing their own monetary policy autonomy.


Trillion

1,000,000 x 1m or 1,000 x 1bn

Trough

A sustained period of low economic growth which usually follows a recession and is usually associated with:

  • Low growth
  • High unemployment
  • Low inflation
  • Low levels of confidence

  • Underwriting

    Is where a bank sets a price at which new securitites will be issued onto the market, with some banks guaranteeing that they themselves will buy up the rest of the shares if they fail to sell at that price. This is one of the main traditional activities of investment banks and this is the main way that they aid their customers to raise finance for their own personal investment projects.


    Unemployment

    Is a term that applies to individuals that are of working age, but currently do not have a job and have been actively seeking employment.

    In most cases, unemployed people are individuals who are willing and available to work but often cannot find a job that matches their preferences. If an individual is unemployed they still make up part of the labour force as they are likely to continue to contribute towards the economy for most of their working life.

    In the UK, the official measures of unemployment and employment is measured using the Labour Force Survey - which is a household survey of the current employment positions of agents. 

    Below is a breakdown of the amount of workers who were classed as employed, unemployed or outside the labour force and economically inactive in the UK from June to August 2014. This measurement is taken using the government's Labour Force Survey.

    There are many different forms of unemployment in an economy:

    • Cyclical unemployment
    • Structural unemployment
    • Frictional unemployment
    • Seasonal unemployment
    • Real wage unemployment (Classical unemployment)

    Unemployment is used as an indicator to judge how strong and robust an economy is and if the unemployment rate is close to the natural rate of unemployment then this is a sign the economy is close to full employment and as a result any further expansions in the economy in the short run will introduce inflationary pressures in the economy. This is why Central Banks of a country always use unemployment data when making their decision on interest rate changes in the economy. 

    Low unemployment is an economic aspect that all governments aspire to achieve because it creates a high level of confidence in the economy which can spur on economic growth and investment. It can also improve the budget position of the government by improving the inflow of tax revenue whilst simultaneously reducing the level of benefits required to be paid out. Low unemployment also satisfies one of the main macroeconomic objectives for the government but it could simultaneously create a conflict with other objectives. The most notable one is the trade-off between unemployment and inflation that is displayed in the Phillips Curve. It can also create problems on the current account position of a country as higher consumption fueled by greater confidence can increase consumption of imports.

    It is important to note that unemployment is not always as negative for an economy as it seems. For instance, a high level of unemployment increases the pool of available workers for firms to employ and this creates the potential for these firms to expand, adding to the productive capacity of the economy. Also with persistent unemployment some workers may become disillusioned with the labour market and decide to go down the self-employment route and by doing so could increase entrepreneurial innovation and activity in the economy, which is beneficial for an economy. 

    Another evaluation point to consider regarding unemployment is that if we have a situation where output falls, it does not always feed into higher levels of unemployment because of important time lags between the economic cycle and the unemployment cycle i.e. firms will postpone laying off workers until they are sure that an economic downturn is likely to be sustained. In some cases firms may even engage in labour hoarding - where they keep their workers on the payroll during an economic downturn, ready to re-employ when the economy recovers.


    Unemployment trap

    When individuals who currently do not have a job do not perceive any benefit in working as the earnings received after taxes is not sufficient to replace the welfare benefits given up when they accept a job. 


    Unintended consequences

    When a government intervention has an impact (usually negative) that was not intended when the policy was implemented e.g. favourable taxation of fuel efficient cars has achieved environmental benefits but has reduced the total tax revenue arising from vehicle licence duty.

    Unit elastic supply

    When the proportionate change in supply is equal to the proportionate change in price. In this case the PES value will be equal to 1.

    Below is a diagram to show the characteristics of a unit elastic supply curve:

    The supply curve has the typical upward sloping relationship between quantity supplied and price, as a result of the greater profit incentives that arise from higher prices. But with a unit elastic supply curve, quantity supplied and price change by the same factor when moving along the supply curve. 


    Unit of Account

    Is a nominal monetary unit of measure or currency used to value the cost of goods, services, assets, liabilities, income and expenses. This is one of the three functions of an efficient and successful monetary system, alongside a store of value and a medium of exchange.


    Unitary elastic demand

    The proportionate change in quantity is equal to the proportionate change in price. it will represent a single point on most demand curves (the midpoint of demand curves) or if the demand curve is a rectangular hyperbola (like below) the elasticity value at every point on the curve will represent a Price elasticity of demand value equal to 1.


    Universal Bank

    A financial institution that offers the full range of financial services to customers. These types of bank's offer both the services of a traditonal commerical bank (deposit and lending taking activities) and an investment bank (underwriting of new securities).

    Below is the simple breakdown of a universal bank i.e. its two main functions are to carry out commerical and investment banking activities.


    Unstable cobweb effect

    A period of great market instability which is initiated by a supply side shock. The instability continues for some time as the cobweb diverges due to demand that is more inelastic than supply. It may require government intervention to re-establish a stable equilibrium position.

    A good harvest in period 1 means supply rises to Q1, so that prices fall to P1. If producers plan their period 2 production under the expectation that this low price will continue, then the period 2 supply will be higher, at Q2. Prices therefore fall to P2 when they try to sell all their output. As this process repeats itself, oscillating between periods of low supply with high prices and then high supply with low prices, the price and quantity trace out a spiral. This all occurs because the slope of the supply curve is less than the absolute value of the slope of the demand curve, then the fluctuations increase in magnitude with each cycle, so that prices and quantities spiral outwards. This is called the unstable or divergent case.


    Utility

    The usefulness of or satisfaction with a product i.e. the degree to which a good or service satisfies a consumer's wants or needs. The price consumers are prepared to pay for a good is taken to represent the financial value of utility.


    Utility industry

    An industry that supplies services to an entire economy. The goods or services are usually homogenous in nature and used by most citizens on a daily basis e.g. water, gas, electricity, sewerage etc

    Value Added

    The value-added measure of GDP adds together the value of output produced by each of the productive sectors in the economy.  Therefore it is the increase in the value of goods or services as a result of the production process

    Value added = value of production - value of intermediate goods

    Below is an example of how value added works in the production of food that eventually gets sold in supermarkets. The farm produces the food with a value of £100. The food then gets sent to the meat processor which adds another £100 on to the value taking it to £200. This processed meat then gets sent to the food manufacturers who package and brand the product adding another £200 to the value taking it to £400. Finally the supermarket buys the food from the food manufacturer and tsocks it on their shelves and this takes the final value to £800.


    Value judgement

    A statement that reflects someone’s opinion and is not supported by factual evidence.

    Variable costs

    Costs that are linked to the level of output. An example might be the components needed to make a good, fuel for a delivery vehicle or the electricity used by a piece of machinery. The magnitude of these costs will depend on usage which will be closely linked to output. Costs will increase as output rises and will equally fall as output reduces.

    Below is a graphic that highlights the main variable costs that a firm has to occur.


    VAT

    VAT is a tax that's charged on most business transactions in the UK. Businesses add VAT to the price they charge when they provide goods and services. The tax added is either 5% or 20%.

    Veblen good

    A good that enjoys “snob appeal” i.e. the goods become more attractive as price rises because few people can afford to buy the goods e.g. designer goods. This only applies to small high net worth (HNW) market segments with branded goods and is unlikely to be found in a perfectly competitive market.

    Below is a diagram to illustrate the good's demand curve. In this instance the curve has a positive slope and therefore is upward sloping due to the positive relationship between the two variables: price and quantity demanded. It is extremely rare for a good to have this positive relationship between price and quantity demanded and in most cases is just an empirical theory rather than a form of reality. But an example of this type of good in the real world is basic food staples in times of economic crises. The idea is that if an individual/family is struggling financially and the price of the basic food essentials increase, these individuals end up purchasing more of this essential food item as they can't afford more expensive food items in its place despite the price of the essential good.


    Vertical Integration

    This is where firms decide to merge when they are both operating at different stages of the production processes. This most commonly occurs when a company merges with an important supplier.

    Below is a diagram to show this type of integration occurs when firms from different sectors such as the primary,secondary or tertiary sector merge with another to have one firm that has a complete production process of a good. However, there are two different forms of this type of integration. Vertical Forward Integration involves a supplier merging with one of its buyers such as a newspaper buying up a newsagents. Vertical Backward Integration involves a purchaser buying one of its suppliers such as a car manufacturer buying up a tyre company.


    Visible trade

    Trade in goods i.e. tangible and therefore visible items.

    Volume economies

    Increasing the dimensions of any structure will lead to a proportionately larger increase in capacity. e.g. a increasing the size of a box from 2m sides to 4m sides will increase the surface area by a factor of 4 (material cost) while the capacity increases by a factor of 8.

    Voluntary unemployment

    Workers who have decided not to work, usually because the prevailing wage rate does not incentivise them to work.

    Wages

    The reward for providing labour.

    Wants

    The desires that encourage the consumption of goods and services.

    Wealth

    The amount of assets, valuable items and resources owned by an individual, firm or any country or group. Wealth is usually applied to generate an income for the owners.

    Below highglights some of the basic features of wealth. For instance wealth is the accumlation of value of assets and as a result very little of a person's wealth is spent, with the main reason being because it is less liquid and primarily income is used for day to day transactions.


    Wealth effect

    Any change in consumption that occurs due to an increase in personal wealth e.g. if the value of the stock market doubles this should encourage households to increase consumption.

    Wealth of Nations

    A famous economics book written by Adam Smith, widely renowned as one of the founding fathers of modern economics. the book considered the nature and causes of wealth and aspects of production and free markets.


    Weighting

    Is a statistical technique that allows the emphasis given to different data items to be varied e.g. the goods and services covered by the CPI are weighted to reflect the expenditure of a typical household.

    Welfare benefits

    Benefits paid by a government to help ensure everyone receives a mimimum standard of living.

    Wholesale banking

    When banks provide services to firms and other banks.

    Windfall tax

    A sudden and one off tax that a Government might impose on the profits of suppliers if they are manipulating a market to increase profits at the expense of consumers. The purpose of this type of tax is to curb uncompetitive behaviour.


    Withdrawals

    Actions that reduce the value circulating in the circular flow. This falls into 3 categories - taxes collected by government, money set aside as savings and any money spent on imported goods and services.

    Working capital

    Resources that have entered the production system and are available to be converted into goods and services e.g. components and semi-finished items.

    X-Inefficiency

    Created when there is a lack of competition in a market so firms average costs are higher than they would be with competition. The lack of incentive to control costs causes the average cost of production to be higher than necessary and as a result will be technically inefficient too.

    Below is a diagram of a firm's AC curve to show that when organisational slack leads to a sudden rise in a firm's costs this causes them to move off the existing AC curve to a point that is higher. This does not correspond to an AC curve shift because fundamentally nothing has change to their average costs its just poor managemnt has caused the firm to lie somewhere above this curve.


    Zero Lower Bound

    Is a macroeconomic term used to describe the problem that central banks face in trying to stimulate the economy through a conventional monetary policy when interest rates are already at or close to zero. 

    The central bank of a country is responsible for keeping the inflation rate within their target (e.g. UK Consumer Price Index Target = 2%) to ensure macroeconomic and financial stability across the economy. The conventional way the central bank can do this is through changes in interest rates (bank rate). This is because interest rates affect the return economic agents get on their savings and the interest that banks can charge when lending out cash to borrowers. 

    For instance, if the central bank wishes to use interest rates to stimulate the economy, in order for the economy to move back to the full employment level, then interest rates are cut. Assuming ceteris paribus, this creates less incentive for consumers to save and in the process encourages consumption. The increase in consumption fuels higher demand for goods and services and real output rises. It also helps increase real output through an investment channel - firms now find it cheaper to borrow when acquiring loans to finance productive and profitable investment projects. The increase in investment increases demand and real output even further.

    The combination of channels fuels higher real output which introduces inflationary pressures into the economy. This should theoretically move the economy back to the full employment level at point B, as shown below:

    This is an example of the type of monetary policy that was used in the aftermath of the 2008 financial crisis in the UK, when interest rates dramatically dropped to 0.5% in 2009. This resulted in a upturn in UK economic growth. However, this may have created the perfect economic conditions for economic growth to recover to some degree, but has put the Bank of England in a difficult position regarding the conduct of future monetary policies. 

    This is because when interest rates drop to in and around 0%, the ability of the central bank to stimulate the economy through a conventional monetary policy becomes restricted. This is because there is not much margin for interest rates to fall any further before becoming negative, which is often a policy decision that central banks aim to stay away from. This is because negative interest rates:

    • Encourages consumers to hold onto cash balances - consumers now have to pay the bank that they are depositing their funds with. This means from their perspective, they are essentially paying commercial banks a sum to provide the banks with funds that they can make profit out of. Consumers will have the incentive to hold onto cash at no cost.
    • Encourages banks to keep hold of cash reserves - under the negative rates, banks now have to effectively pay the lenders when they lend a fixed amount of money to them. They will have a incentive to hold onto cash reserves as no cost associated with this. 

    These two effects combined means that once interest rates approach zero, the central bank can no longer use the base rate to control the economy in the conventional way. This is known as the 'Zero Lower Bound Problem'.

    This is a key evaluation point to mention if tackling an exam question on the impact of monetary policies on the macroeconomic performance of the economy, particularly if you are making reference to the effectiveness of such policies i.e. if interest are close to zero the central bank may have to turn to alternative monetary policy instruments such as Quantitative Easing. 


    Zombie Bank

    Is a financial institution that has an economic net worth less than zero but continues to operate because its ability to repay its debts is shored up by implicit or explicit government credit support. As the net worth of a bank is defined as the value of a bank's assets minus the value of a bank's liabilites. These types of bank's that are kept as an ongoing regulatory concern must have a negative net worth so effectively are banks that should be 'dead' in terms of solvency but are kept running by the regulators.


    Display # 
    Forgot your password?